
What Is the Sales Report?
The Sales Report is an automatic record of everything your business has sold over a period you choose — a day, a month, a year, or any range of dates.
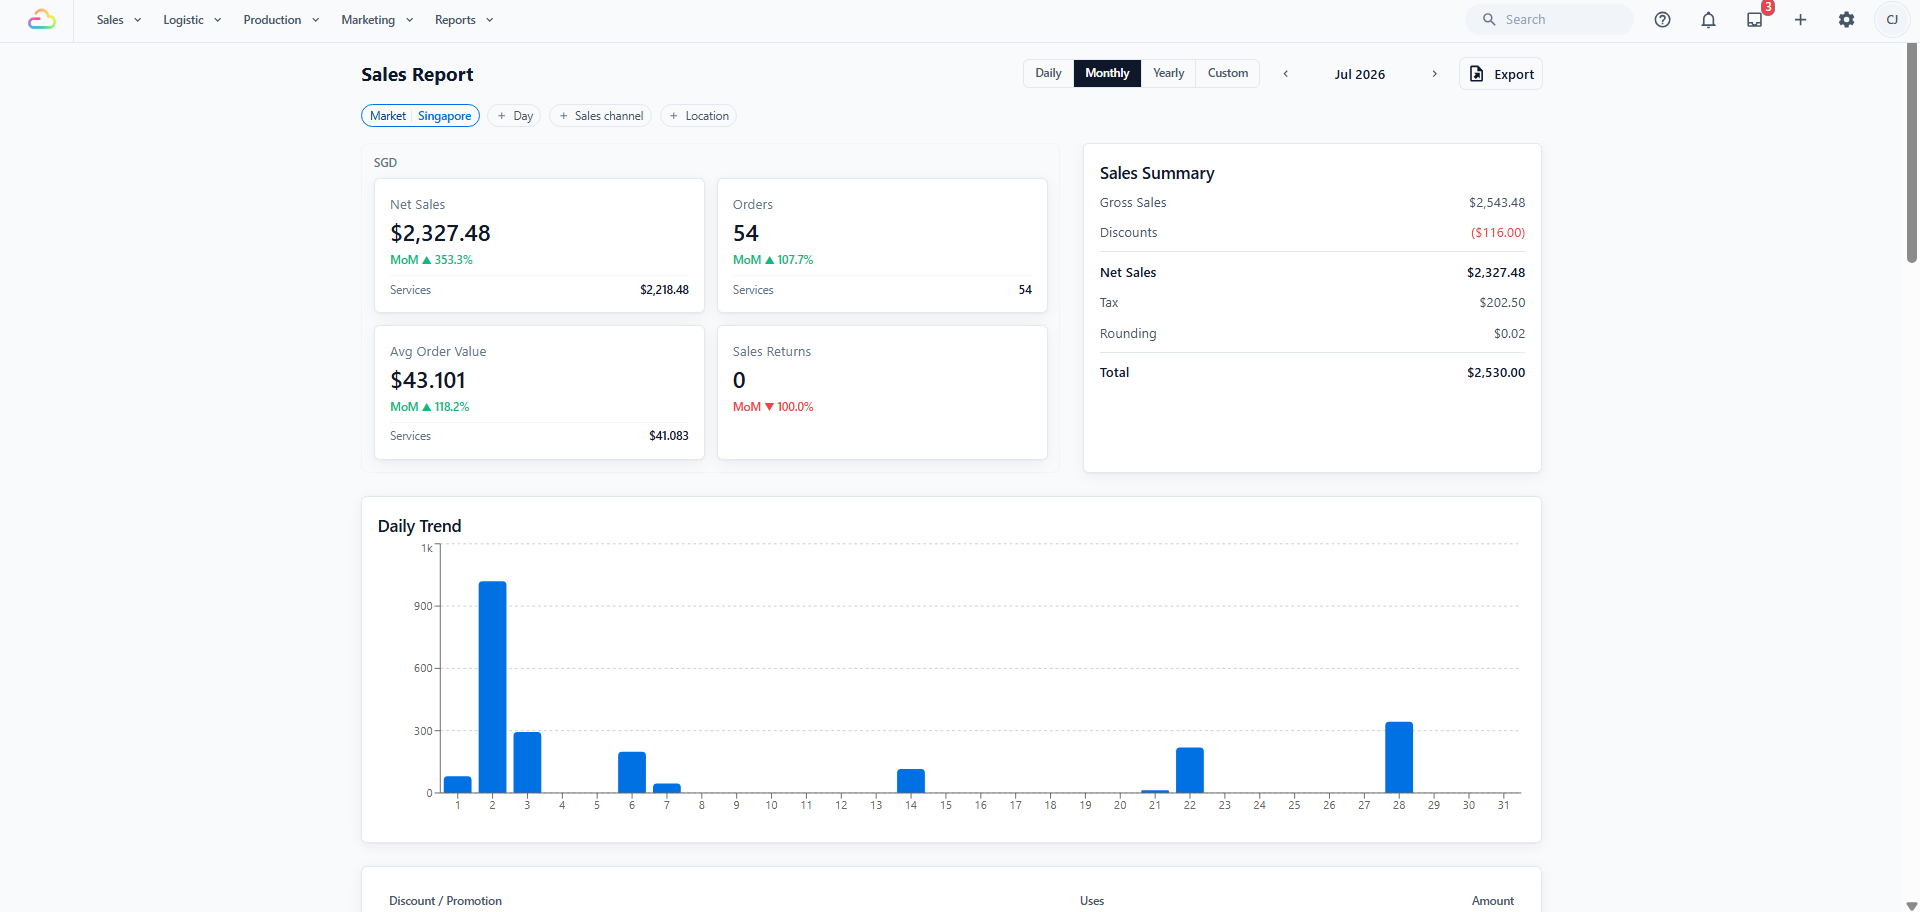
You do not enter anything into it. Each time an order's price is confirmed, at the counter, online or on the mobile app, EasyBiz adds that amount. Discounts, returns and cancellations are taken off the same way. There is nothing to set up.
When an Order Becomes a Sale
An order is recorded as a sale on the date its price is confirmed. It is not recorded when the order is created, and not when it is paid.
Price confirmation is the point at which the amount payable has been agreed. Before that point, the order exists but there is no sale to report.
| Action | Effect on the Sales Report |
|---|---|
| Order created and left as a draft, or pricing not yet confirmed | None. Nothing is recorded. |
| Price confirmed on the order | The full amount is recorded as a sale on that date. |
| Payment taken, before or after confirmation | None. A payment is a movement of money, not a sale. |
| Price changed on a confirmed order, where permitted | Only the difference is recorded, as an adjustment on the date of the change. |
| Notes, photographs, item descriptions or work order details edited | None. No amount has changed. |
| Sales return processed | The returned amount is deducted on the date the return is processed. |
| Payment refunded to the customer | None on its own. |
| Confirmed order cancelled | A cancellation entry is recorded, offsetting the original sale. |
| Sales return voided | The amount is added back on the date of the void. |
Which Date Is Used
Every entry carries a date. That date is determined as follows.
| Order type | Date recorded |
|---|---|
| Walk-in, online or app order | The date the price was confirmed |
| B2B agent order — a hotel, corporate account or partner you invoice | The order date |
| Any order dated within a sales period you have already closed | The first date that is still open, see How Sales Periods Affect This Report below |
Why B2B orders differ. For agent and corporate accounts, the order date is the date shown on the invoice you issue. Recording the sale on the same date keeps the Sales Report and the agent invoice consistent.
How Sales Periods Affect This Report
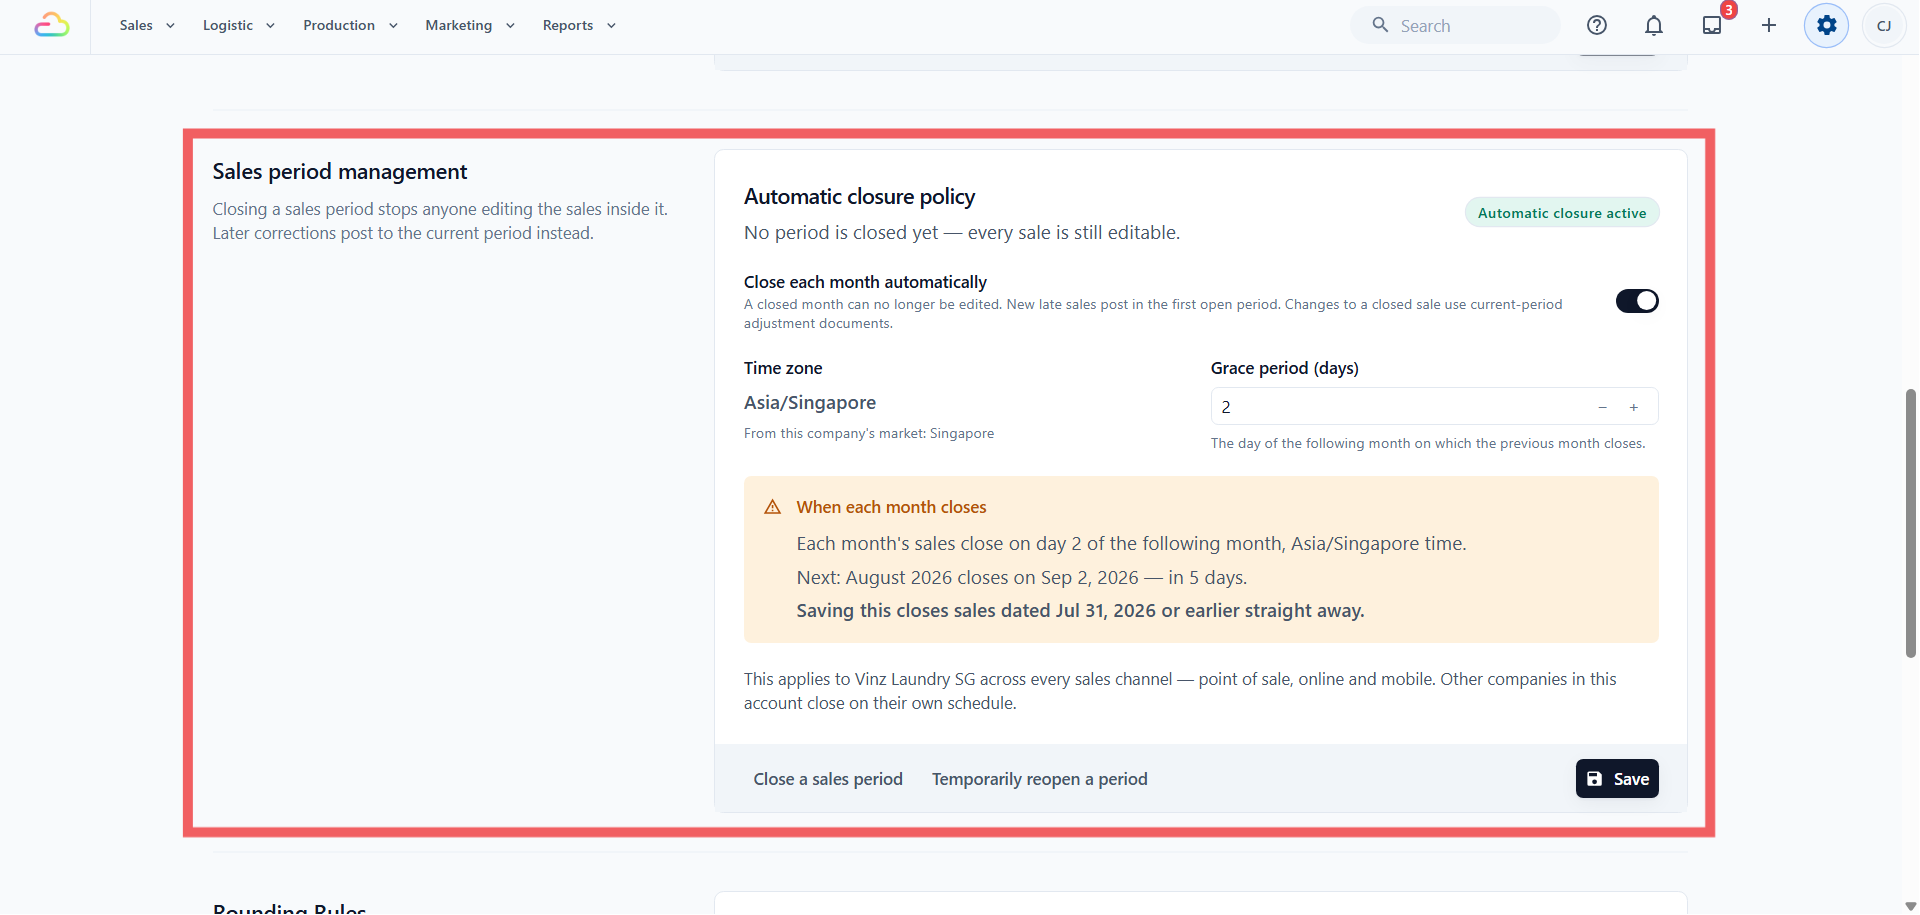
Sales figures for a finished month should not change after you have filed them. A sales period is how EasyBiz protects them, and it is the most common reason a figure on this report is not where you expect it to be.
Closing a period locks the money figures on every sale up to a date you choose — the quantity, price, discount and total. It does not freeze the order. Your team can still add notes and photographs, take payment on an old unpaid order, and reprint a receipt. What they cannot do is change what an old sale was worth.
It is set under ⚙️ Settings → Company → Sales period management.
What this means for the figures on this page
| Situation | Result |
|---|---|
| July is open, and a July order is corrected in August | The July figure changes to reflect the correction. |
| July is closed, and a July order is corrected in August | July stays exactly as you filed it. The correction is recorded in August under Prior-period adjustments. |
A correction always falls into the period you are in now, never into one you have already filed. Nothing is blocked and nothing is lost — only the date it lands on changes.
Reading the Prior-period Adjustments Table
This table lists corrections that belong to an earlier closed period but were recorded in the period you are viewing. It is the first place to look when a past figure and a current figure do not agree.
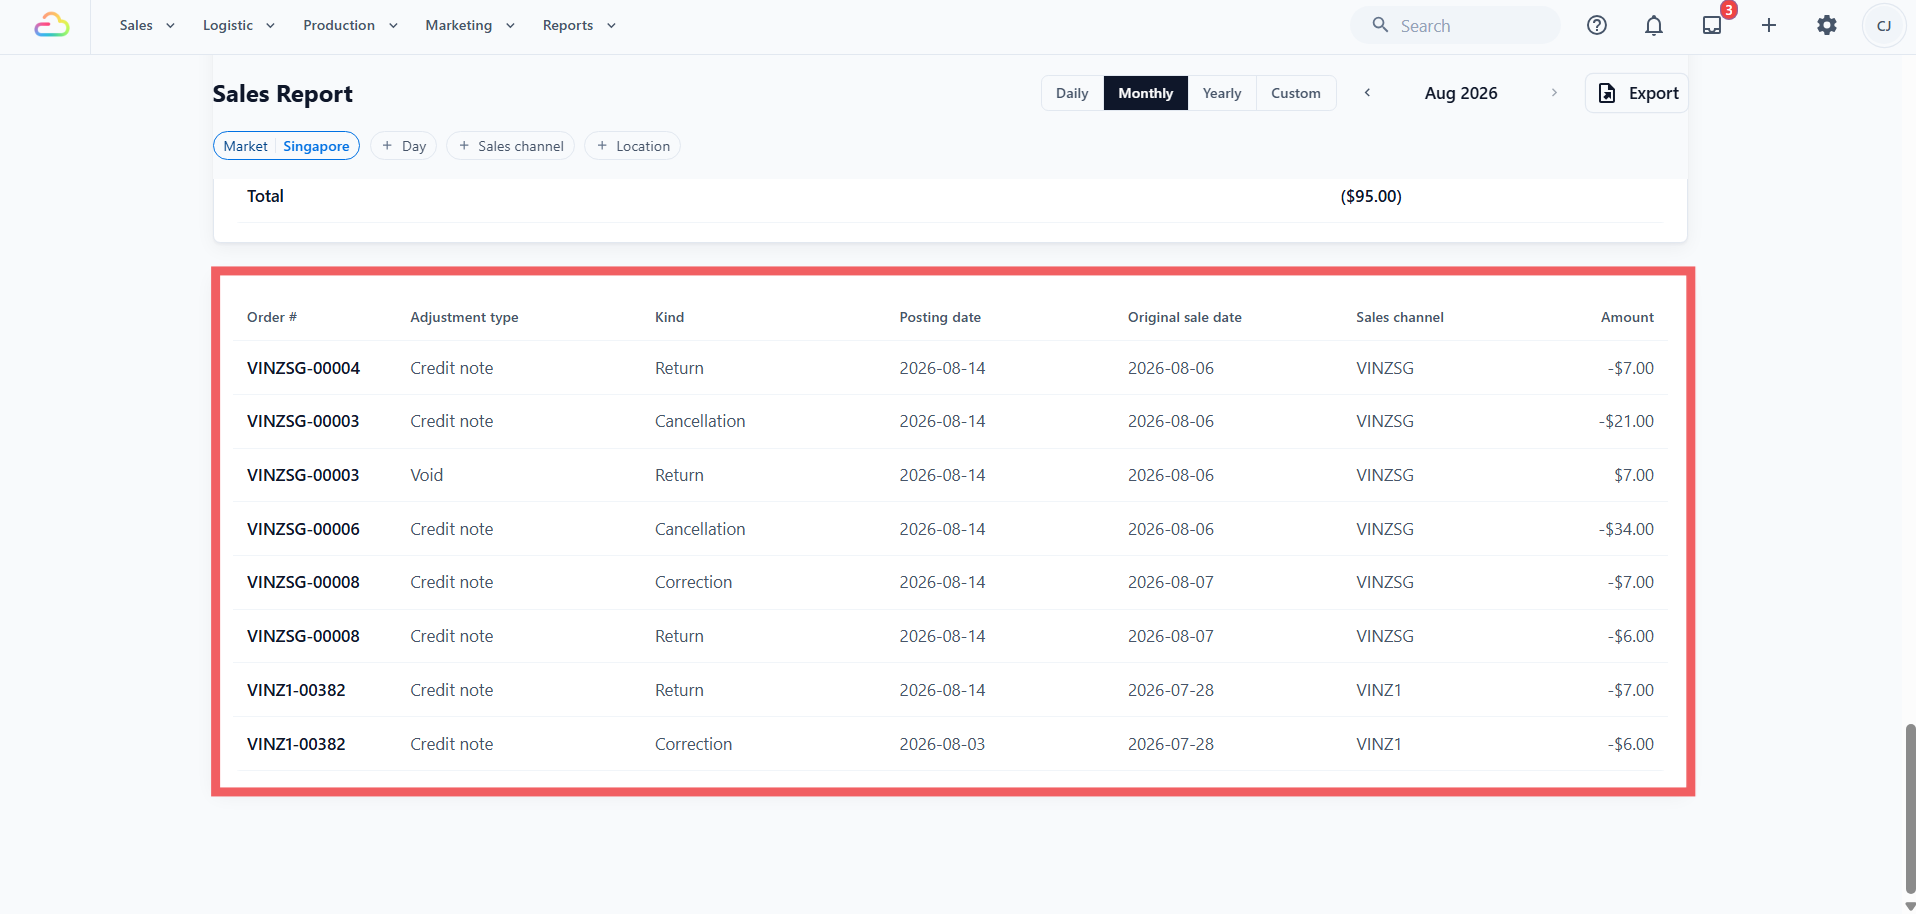
You will find this table at the very bottom of the page, below Sales Returns. It appears in Monthly view, and in Yearly view once you select a Posting month. It is not shown in Daily or Custom view.
| Column | What it tells you |
|---|---|
| Order # | The original order the correction relates to |
| Adjustment type | Sale, Amendment, Credit note or Void |
| Kind | Return, Cancellation or Correction |
| Posting date | When the correction was recorded, inside the open period |
| Original sale date | The date of the sale being corrected, inside the closed period |
| Sales channel | Where the original sale came from |
| Amount | The value of the correction |
Both dates are shown, so an August credit note can always be traced back to the July sale it belongs to.
Opening the Report
In the top navigation bar, open the Reports menu.
Click Sales.
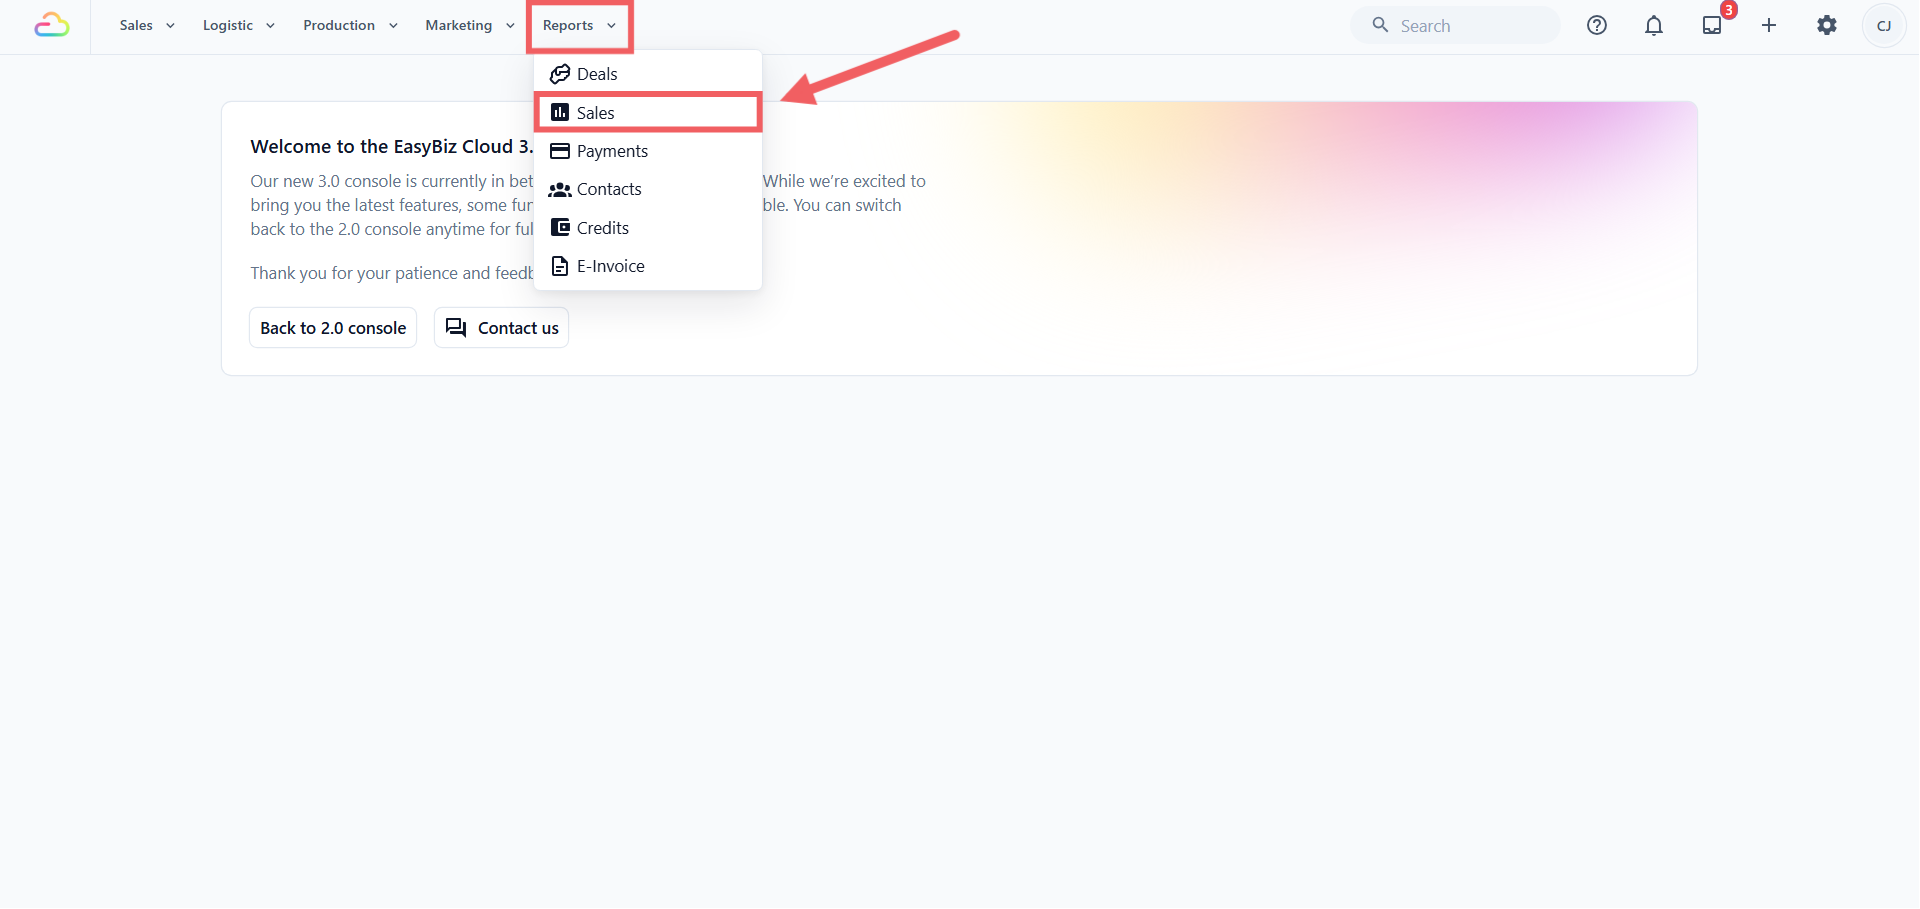
The page is titled Sales Report.
Choosing a Period
The four period buttons are at the top right of the page, beside the date picker and the Export button.
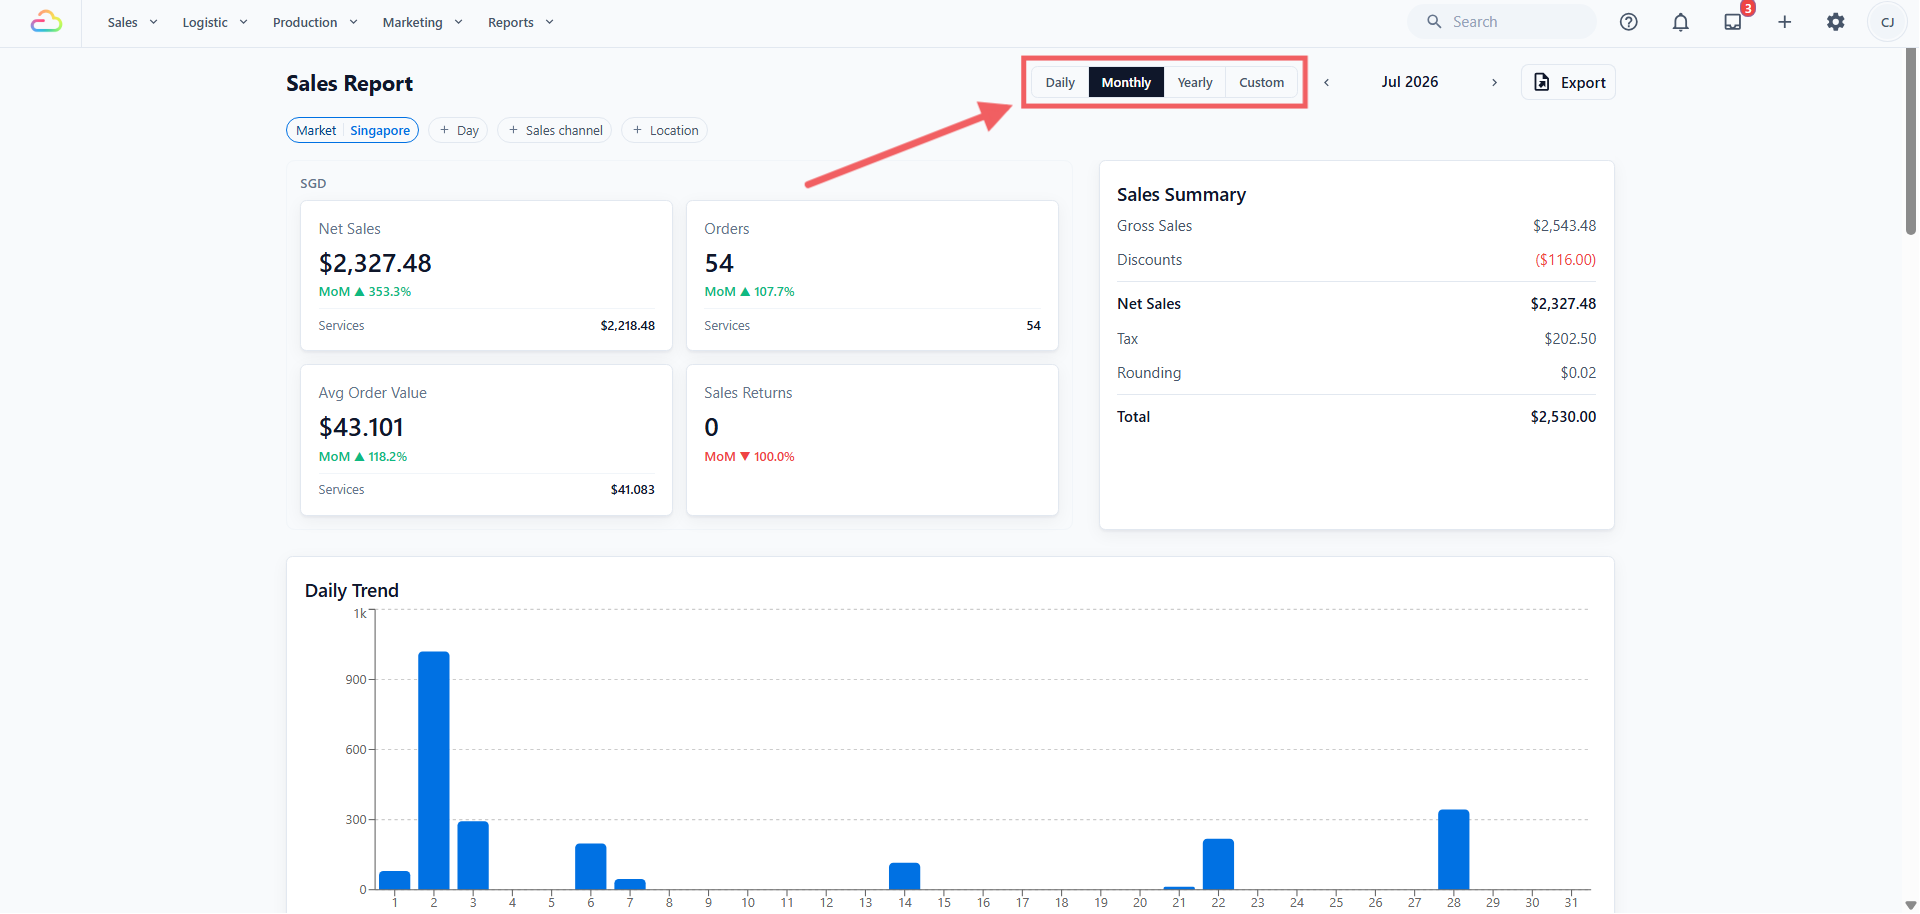
What each period compares against
| Period | Shows | Comparison used on the cards |
|---|---|---|
| Daily | A single day | The previous day, and the same weekday one week earlier |
| Monthly | A calendar month | The previous month, and the same month one year earlier |
| Yearly | A calendar year | The previous year |
| Custom | Any range up to 366 days, ending no later than today | The same number of days immediately preceding your range |
The small percentages on the cards
Each card shows one or two percentages underneath the figure. The short label tells you what it is being compared against.
| Label | Meaning | Shown in |
|---|---|---|
DoD |
Day on day — against the previous day | Daily |
WoW |
Week on week — against the same weekday last week | Daily |
MoM |
Month on month — against the previous month | Monthly |
YoY |
Year on year — against the same month last year, or the previous year | Monthly and Yearly |
In Custom view the percentage compares your range against the range of the same length immediately before it. For a 14-day range, that is the 14 days before it.
A percentage only appears when there is something to compare against. If the earlier period had no sales, or you have not been on EasyBiz that long, the line is simply left out. That is not an error.
Which sections appear in which period
Sections are shown only where they are meaningful.
| Period | Trend chart | Order Entries | Prior-period adjustments |
|---|---|---|---|
| Daily | None — a single day has no trend | Shown | Not shown |
| Monthly | Daily Trend | Not shown | Shown |
| Yearly | Monthly Trend | Not shown | Shown once a posting month is selected |
| Custom | Daily Trend | Not shown | Not shown |
Applying Filters
The filter row sits directly below the page header. Filters change what the whole page shows from the cards, the summary and every table below.
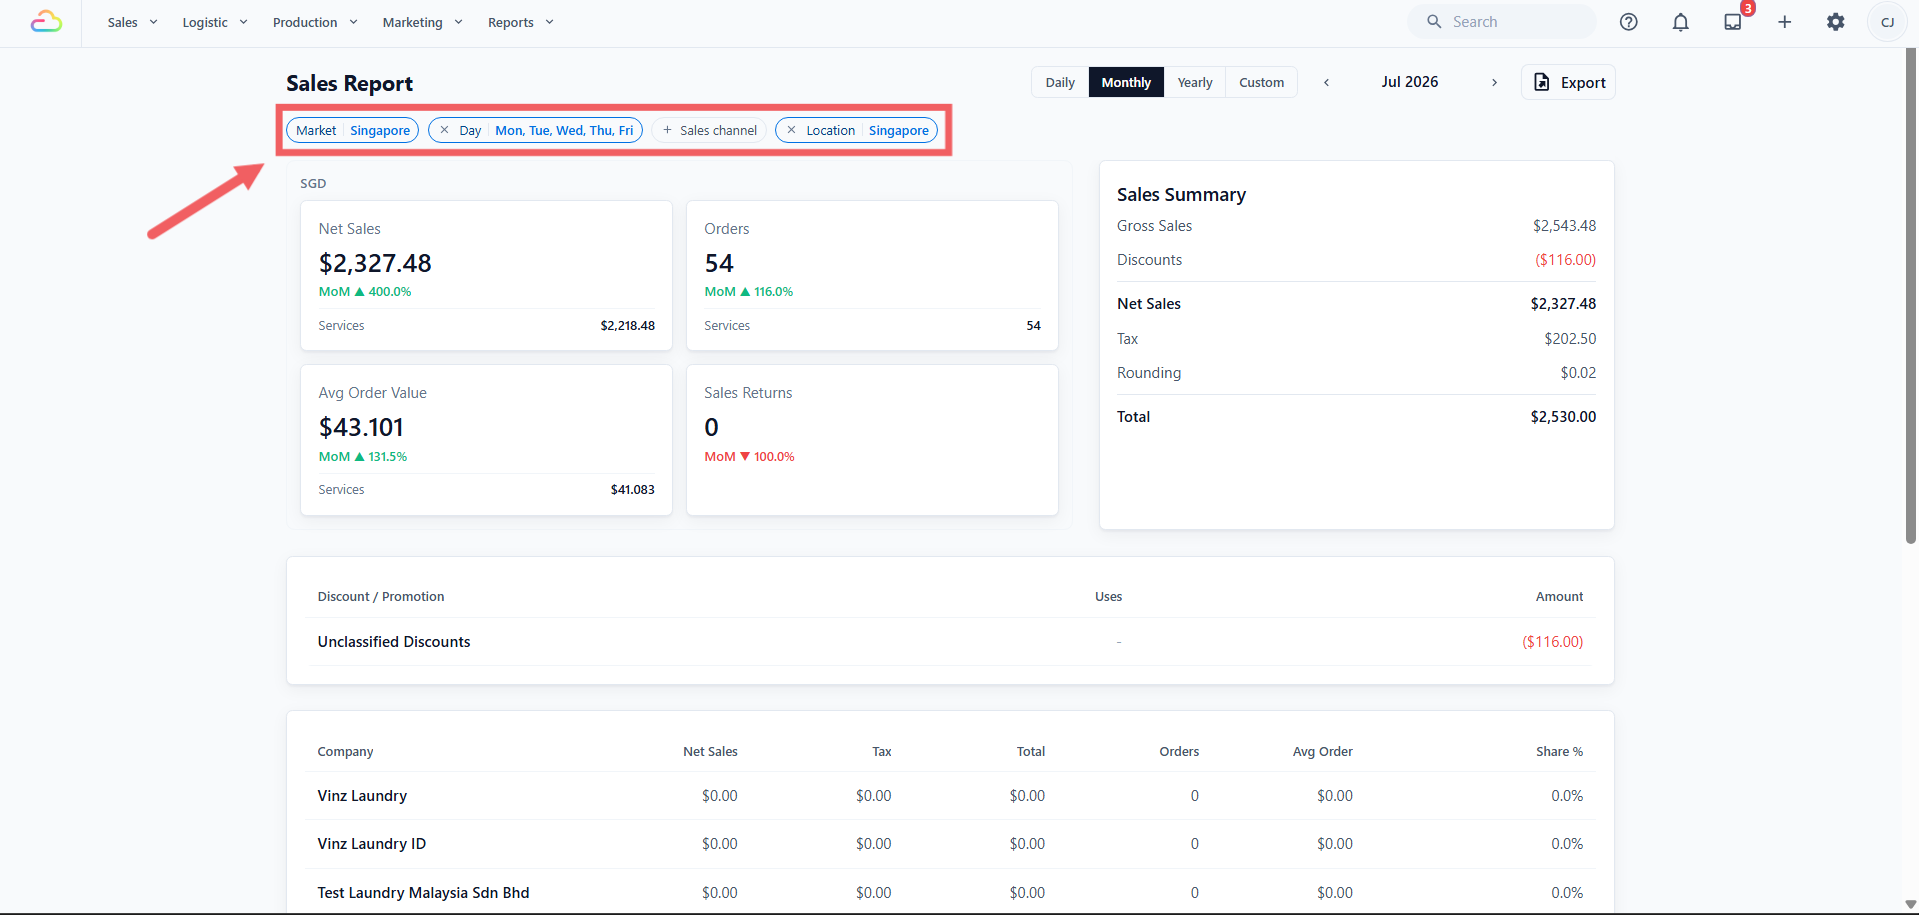
Market — a market is a country you trade in. Each market has its own currency and its own tax rules, so the report shows one market at a time and figures in two currencies are never added together. This filter is always applied. If you trade only in Singapore, your Singapore market is selected for you and there is nothing to choose.
Day — available in Monthly and Custom only. Select one or more weekdays to assess their trade separately.
| Selection | Result |
|---|---|
| None selected | Every day in the period |
| Sat | Saturdays only |
| Any combination | For example Fri, Sat and Sun to review weekend trade |
Sales channel — a sales channel is a place where orders are taken: a shop counter, your online store, or your mobile app. This filter narrows the report to one of them.
Location — a location is a physical site. This filter narrows the report to one address, which may take orders through more than one channel.
Reading the Four Cards
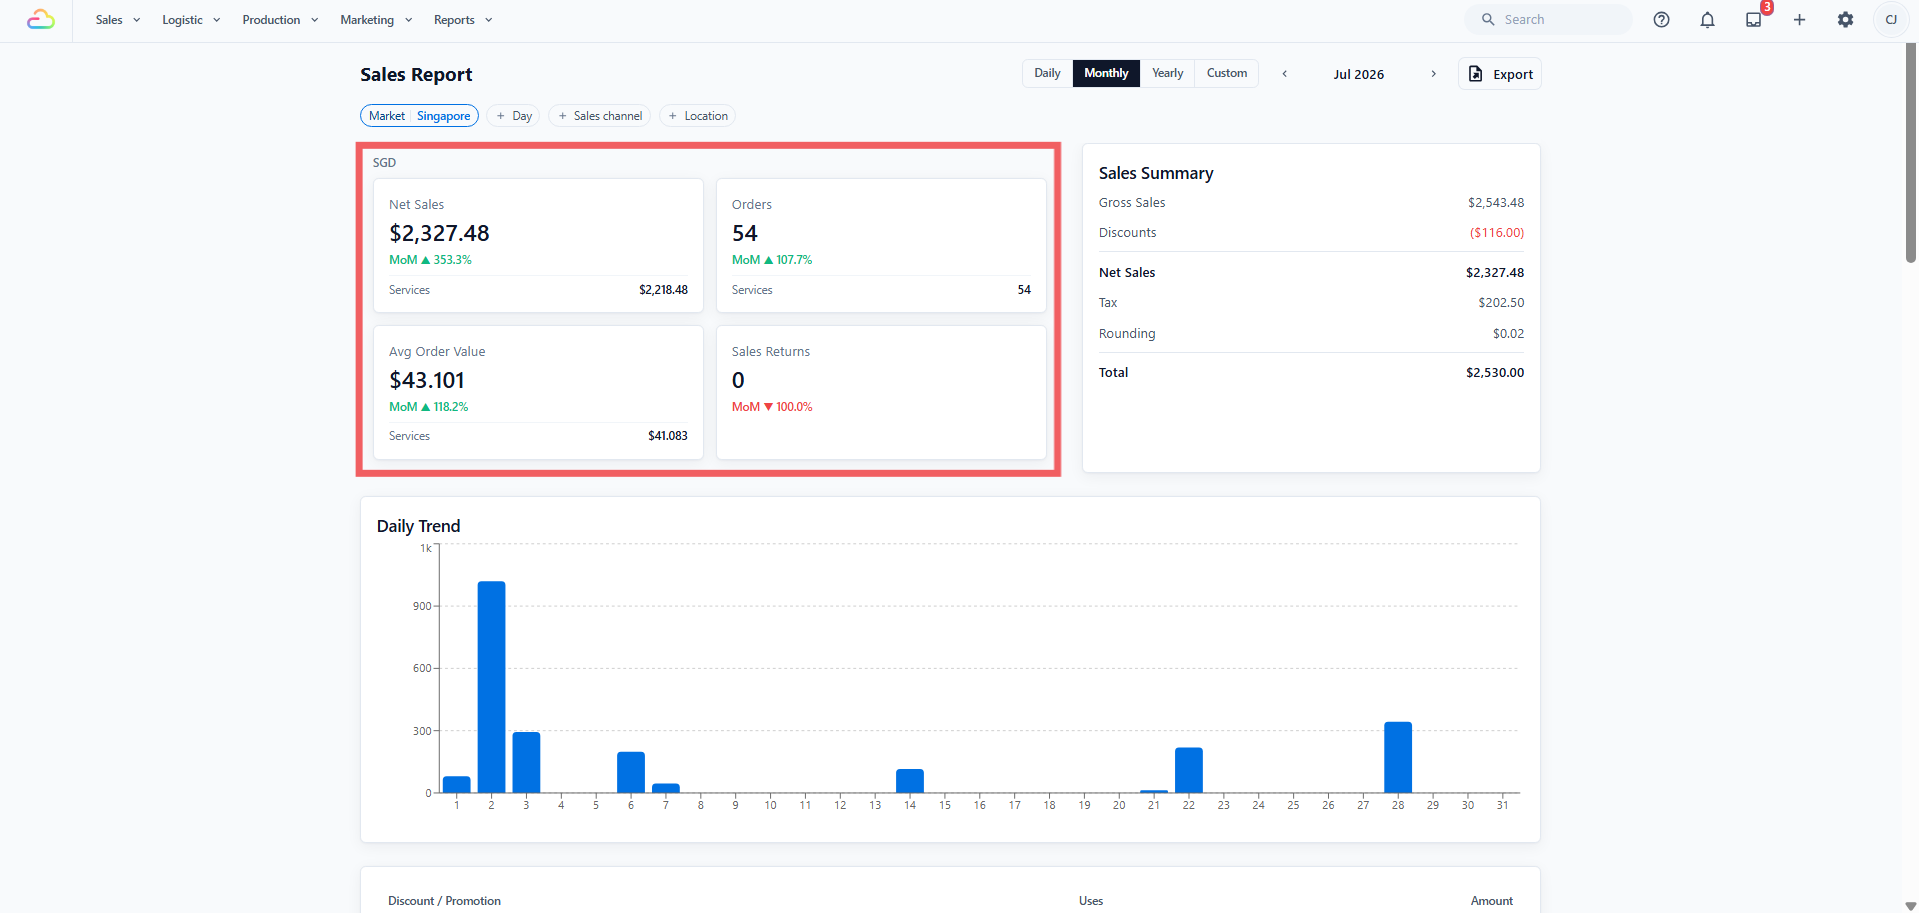
| Card | Meaning |
|---|---|
| Net Sales | The value of everything sold in the period, after discounts. This is the headline figure. |
| Orders | The number of orders recorded in the period. |
| Avg Order Value | Net Sales divided by Orders. |
| Sales Returns | The number of returns issued. This is a count, not an amount. Amounts appear in the Sales Returns table below. |
Each card also shows a percentage change against the earlier period, using the comparison rules above.
If you sell both services and retail products, Net Sales, Orders and Avg Order Value each show a Services and Retail split beneath the figure.
Reading the Sales Summary
The Sales Summary, beside the cards, shows how the total is composed.
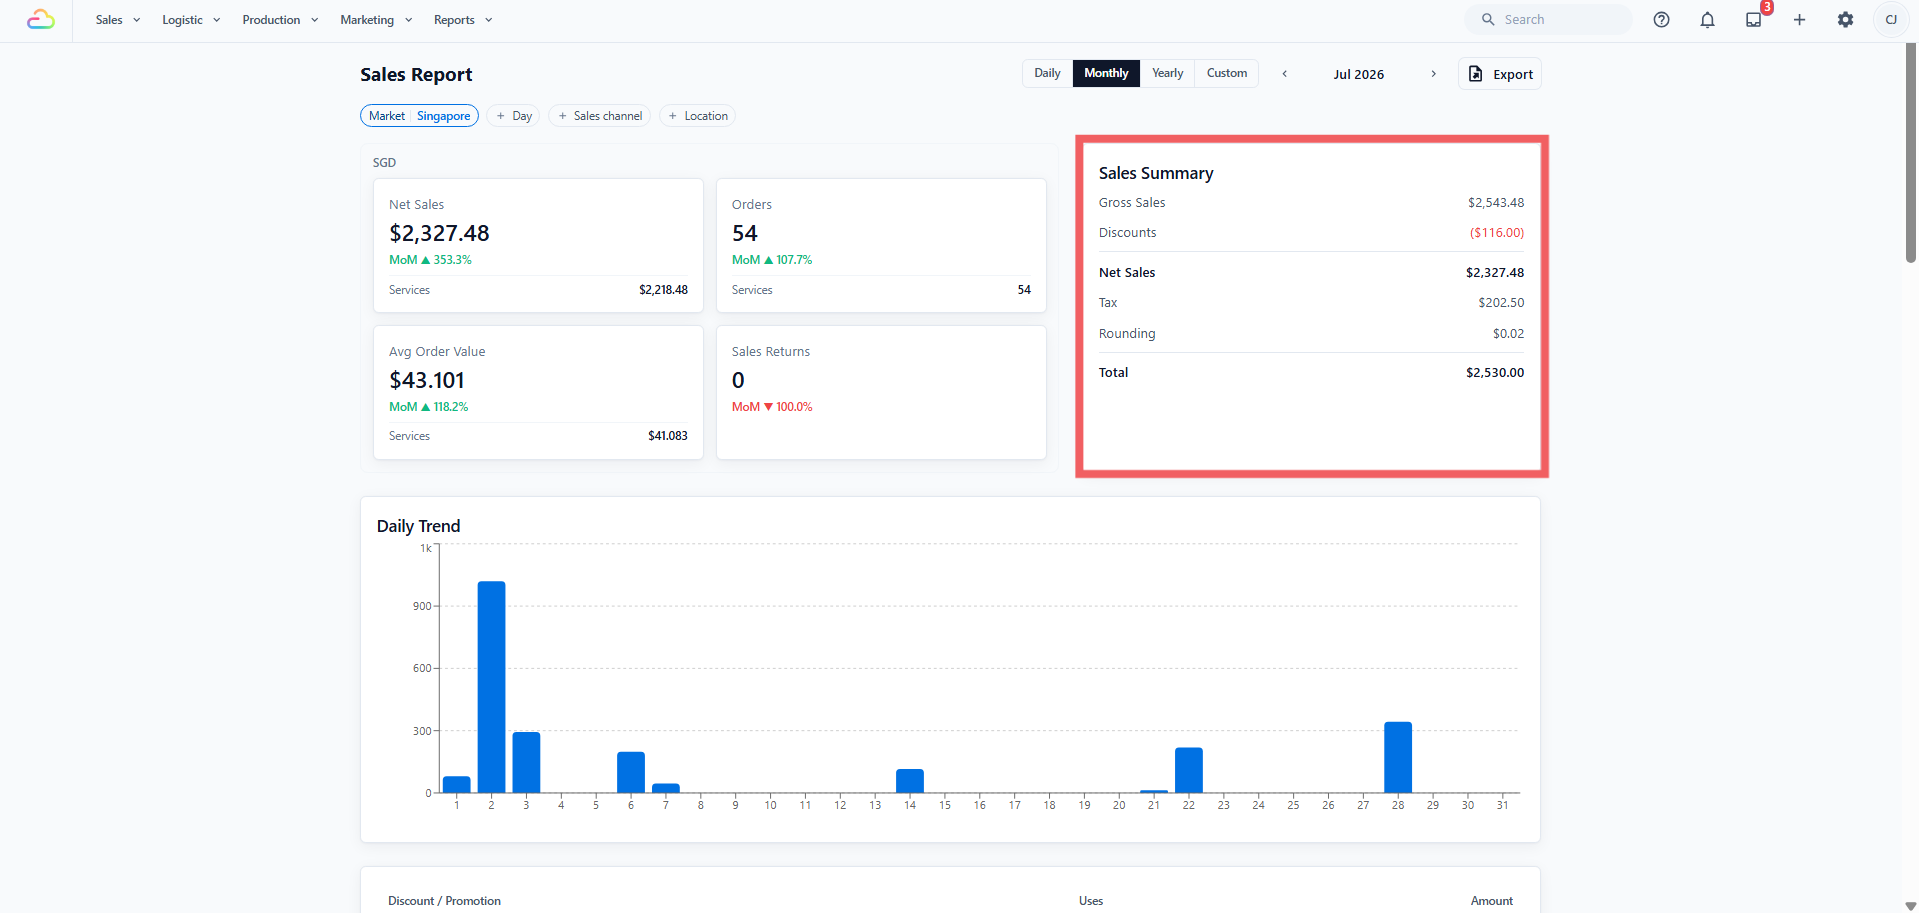
| Row | Meaning |
|---|---|
| Gross Sales | Everything charged, including surcharges, before discounts |
| Discounts | Total discounts given, shown as a negative figure |
| Net Sales | Gross Sales less Discounts — the same figure as the card |
| Tax | GST or other tax on the period's sales |
| Rounding | Cash-rounding adjustments |
| Total | The amount payable by customers, including tax and rounding |
The Breakdown Tables
Below the cards, the same period is grouped in different ways. Every grouping adds up to the same Net Sales figure unless a filter is applied. A table is hidden when it has nothing to show.
| Table | What it shows | Appears when |
|---|---|---|
| Daily Trend / Monthly Trend | A bar chart across the period. Hover a bar for that day's sales, order count and channel split. | Monthly, Yearly and Custom views |
| Discount Breakdown | What each discount cost you, with a drill-down to the orders behind it | At least one discount was given |
| Sales by Business | Sales per sales channel — each counter, online store or app is one row | No sales channel filter is applied |
| Sales by Company | Sales per legal company registered in your account, where you run two registered entities. Not a list of B2B customers. | You have more than one company, and no channel filter is applied |
| Sales by Business Unit | Sales per line of service, for example Laundry against Bag Repair | You run more than one business unit, and no channel filter is applied |
| Sales by Lead Source | Sales grouped by how the customer found you, with campaigns listed beneath | At least one order has a lead source, and no channel filter is applied |
| Net Sales by Product | Sales per product or service option, split into Service Items and Retail Products where both are sold | The period has sales |
| Sales Returns | Every return in the period, with order number, date, channel, amount and note | At least one return was issued |
| Prior-period adjustments | Corrections belonging to a closed period — explained under How Sales Periods Affect This Report | Monthly view, or Yearly with a posting month selected |
| Order Entries | A line-by-line record of a single day | Daily view, when the day has entries |
Order Entries is the one to open when a day's total is not what you expected.
| Entry type | What it is |
|---|---|
| Sale | A price was confirmed on an order. Adds to the day. |
| Amendment | The price of an already-confirmed order was changed. Only the difference is shown. |
| Credit Note | A sale being reduced — a return or a cancellation. Subtracts from the day. |
| Void | An entry reversing an earlier one, used when something was recorded in error. |
Why a Table May Not Appear
Tables are shown only where they have data to present. Their absence does not indicate a fault.
| Table | Appears when |
|---|---|
| Discount Breakdown | At least one discount was given in the period |
| Sales Returns | At least one return was issued in the period |
| Sales by Company | More than one legal company is configured |
| Sales by Business Unit | More than one business unit is operated |
| Sales by Lead Source | At least one order in the period has a lead source recorded |
| Sales by Business, Company, Business Unit, Lead Source | No sales channel filter is applied. Once the report is filtered to one channel, these comparisons are no longer applicable and are withheld. |
| Prior-period adjustments | Monthly view, or Yearly view with a posting month selected |
| Order Entries | Daily view, and at least one entry exists for that day |
Exporting to Excel
The report can be downloaded as an Excel file (.xlsx) — useful for sending figures to your accountant or working on them yourself.
- Click Export at the top right of the page.
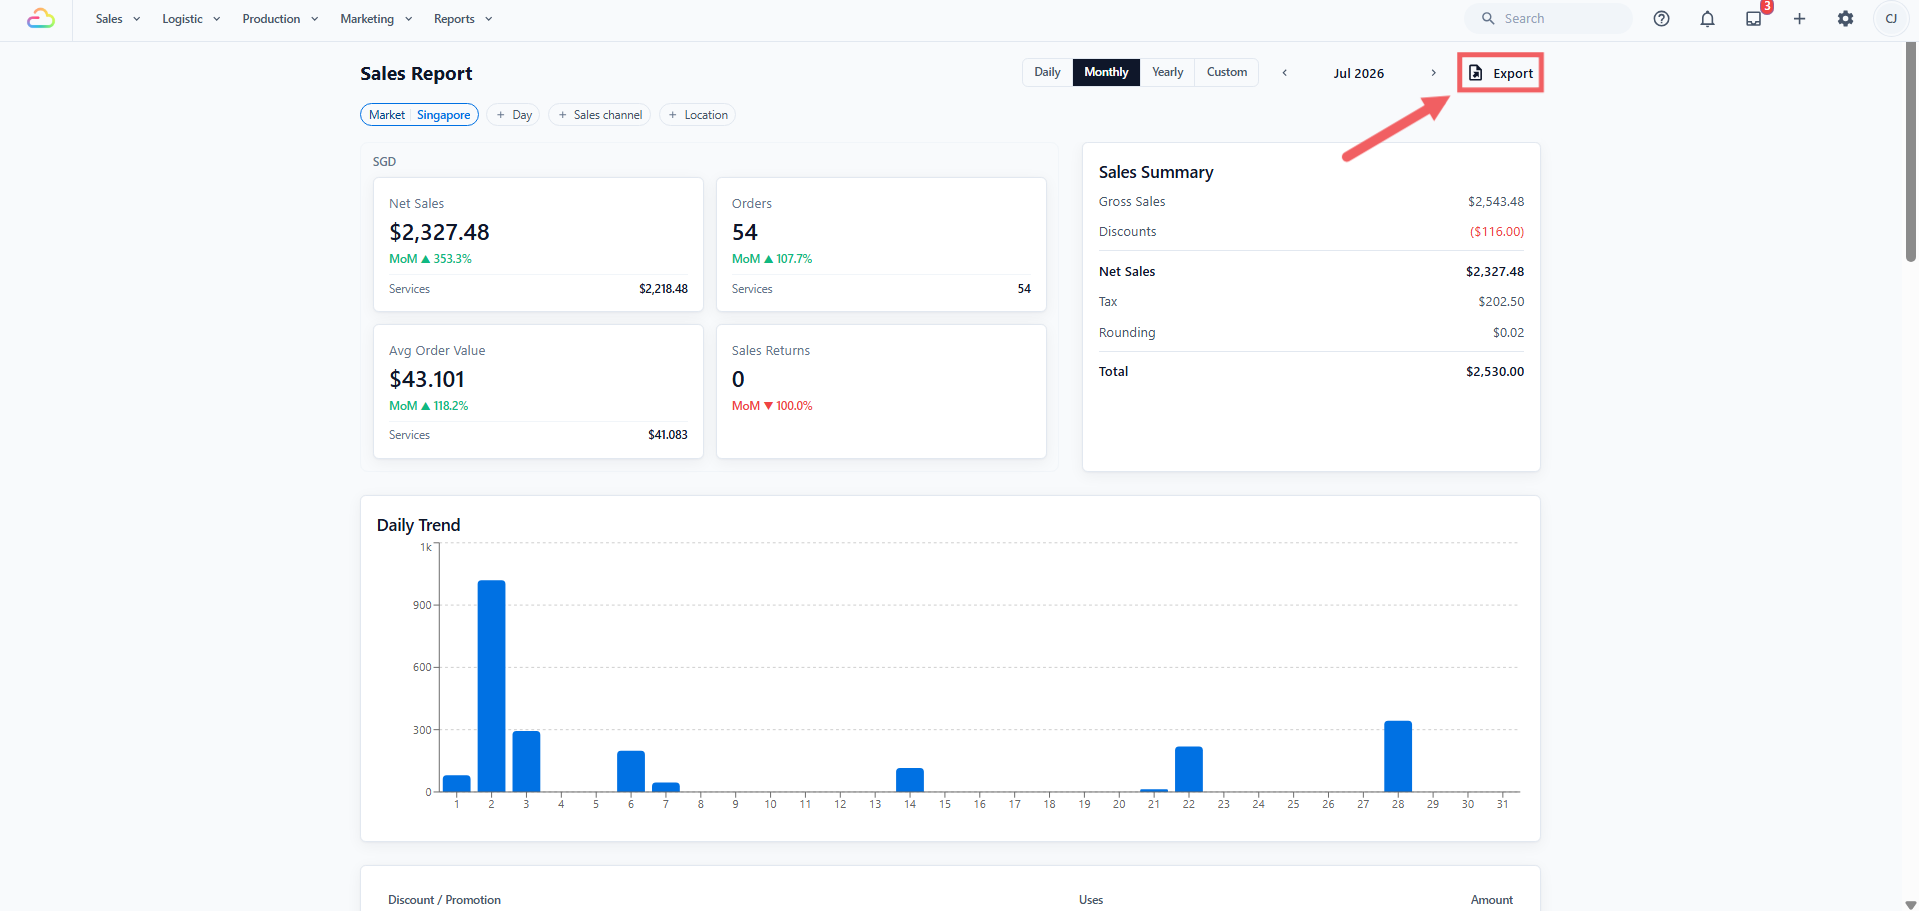
Check the date range. It is filled in from the period on screen and can be changed.
Choose which sales channels to include, or leave it empty for all of them.
Decide whether to include entry-level detail. Left unticked, you get summary and grouped sheets. Ticked, the file also lists every entry and every line item.
Click Export.
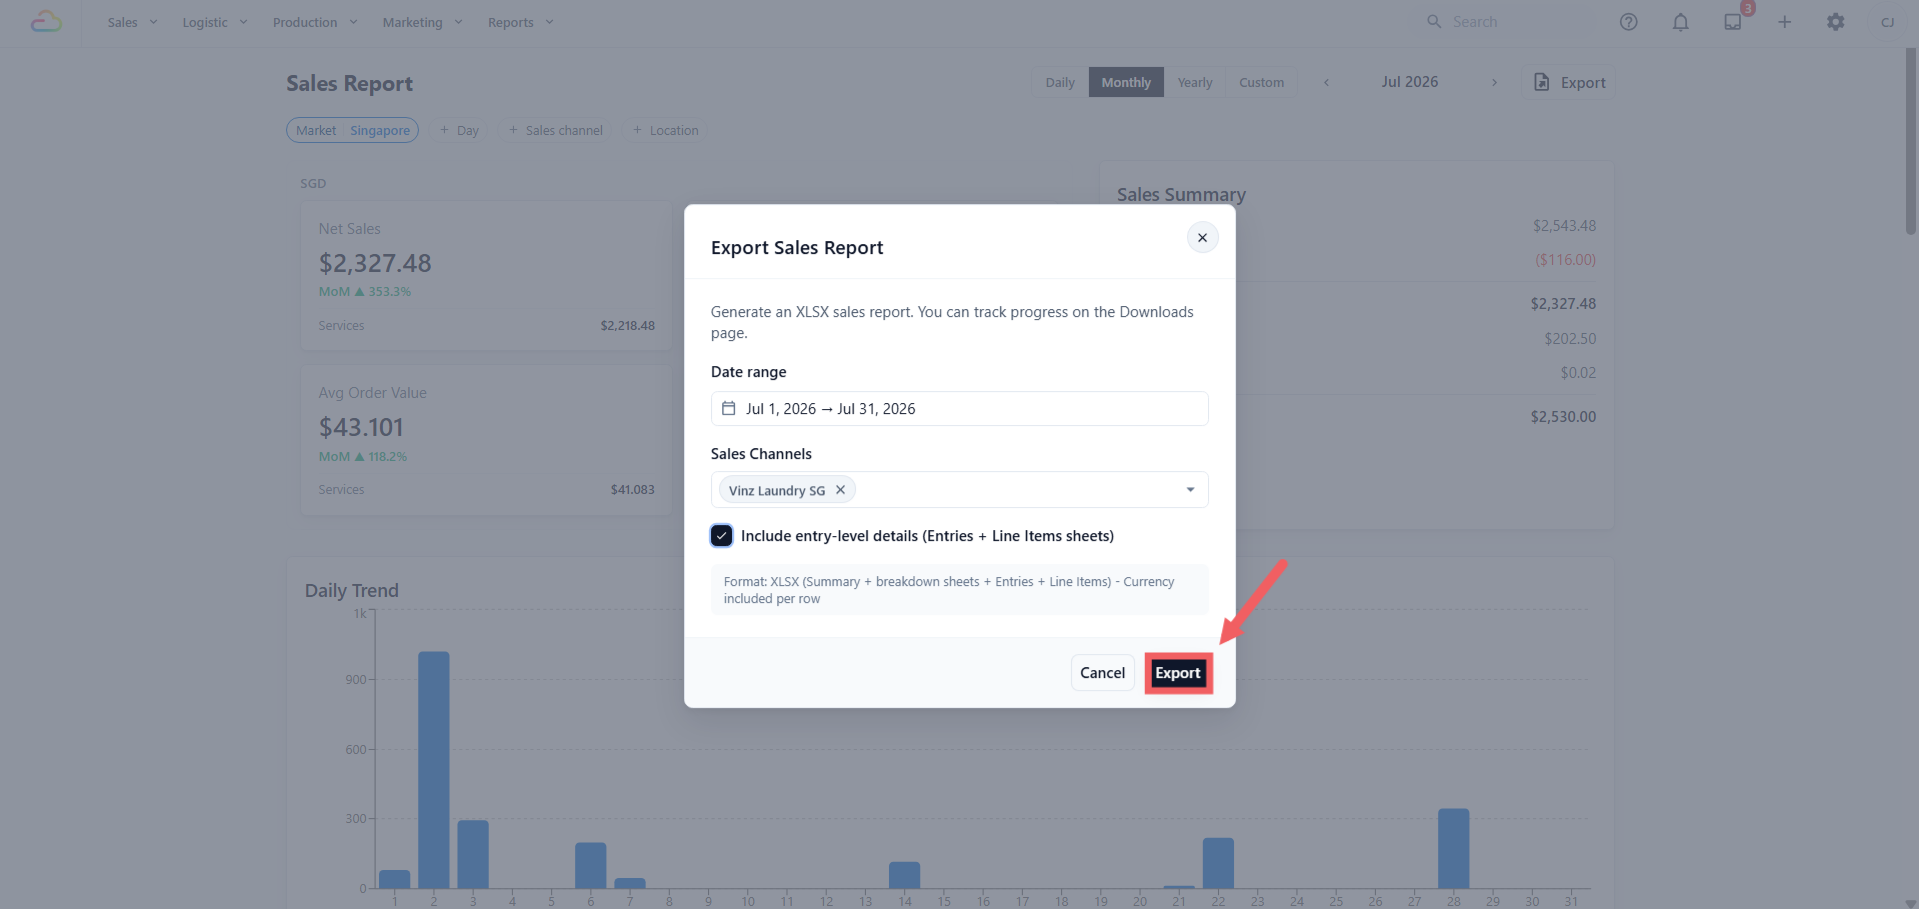
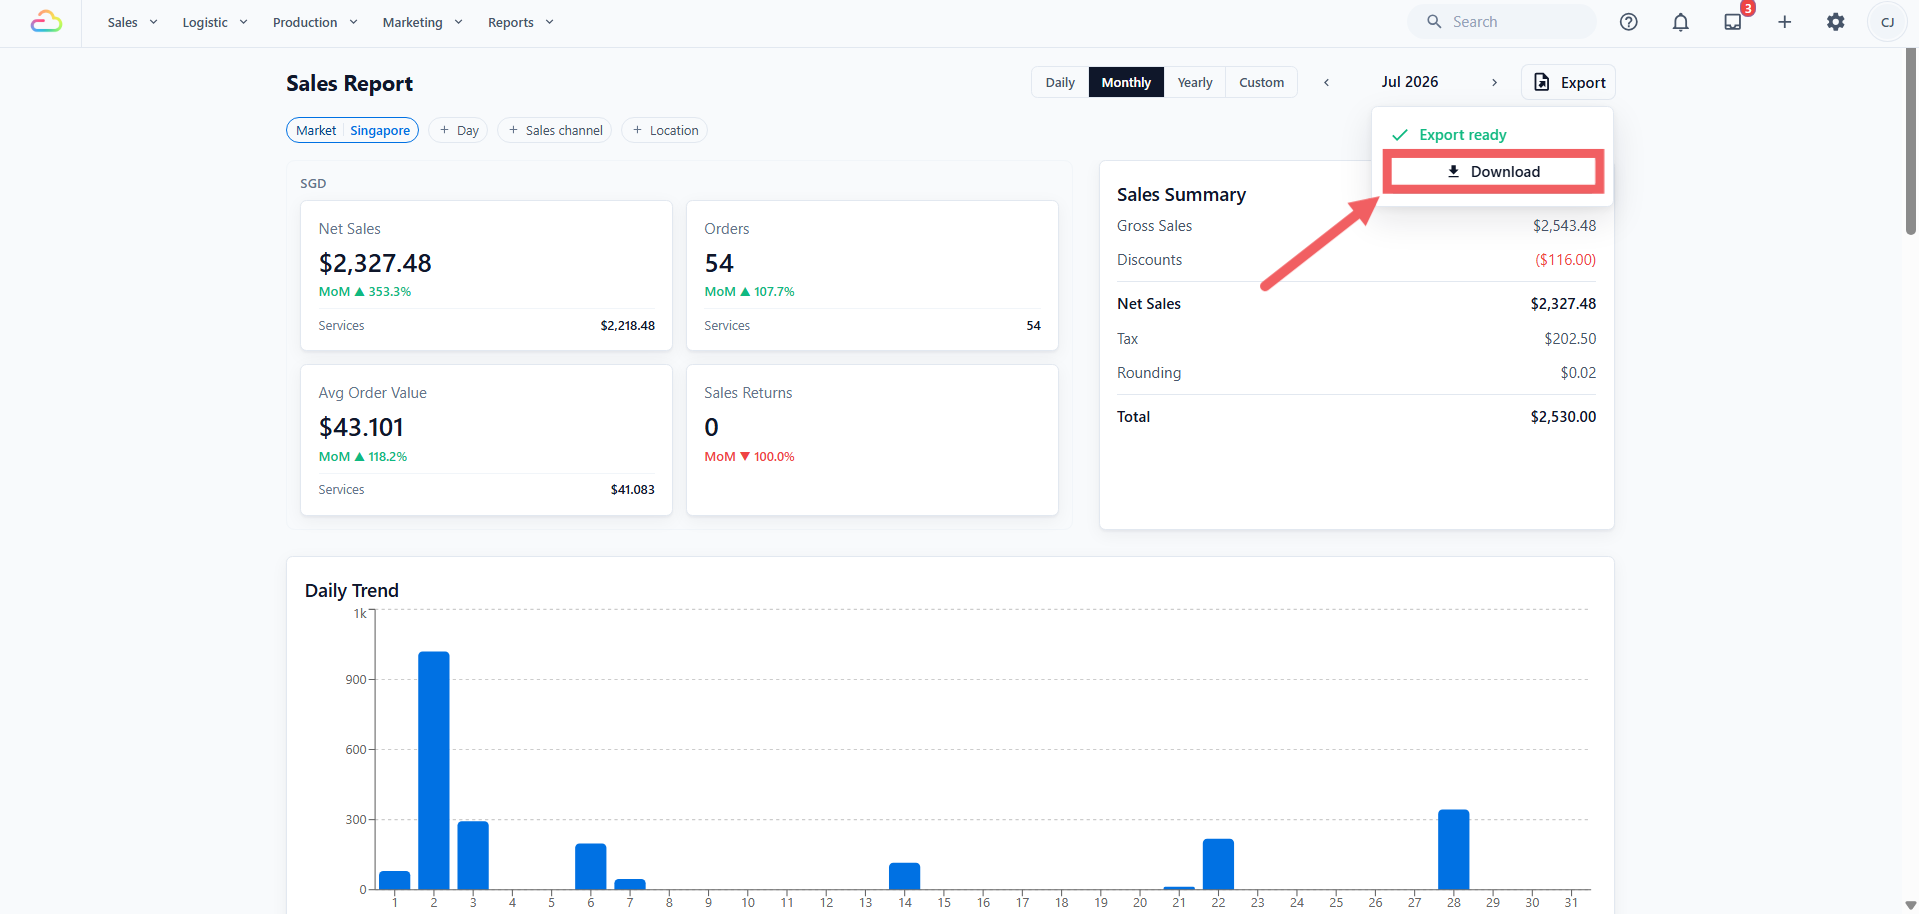
The file is prepared in the background. When it is ready, a small Export ready panel appears on the Export button, click Download to save it. You can also find it any time on the Downloads page.
What is inside the file
| Sheet | Contents |
|---|---|
| Summary | The same figures as the Sales Summary on screen |
| Daily Sales | One row per day in the range |
| By Sales Channel, By Company, By Business Unit, By Market, By Location | The same groupings as the tables on the page |
| By Source | Sales by how the customer found you |
| Discount Promotion | Each discount and what it cost |
| Entries, Line Items | Only when you tick the detail box |
| What you export | Longest range allowed |
|---|---|
| Summary and grouped sheets | 366 days |
| With entry-level detail | 92 days |
If the range is too long, the dialog says so and the Export button stays switched off. Shorten the range, or untick the detail box.
If the Figures Appear Incorrect
Check the following in order.
The page is empty. Check the Market filter, then the period. Daily shows one day only.
The report does not agree with the till. This is normally the difference between sales made and money received, described at the start of this article. Unpaid orders are included as sales; payments received against earlier orders are not. Compare against the Payments report and the shop's Close of Day slip. See Why Report Totals Can Differ.
A past month has changed. That month was still open. Close each month once it has been checked. See Managing Sales Periods.
A correction from an earlier date appears in the current period. The original date falls within a closed period, so the correction was recorded in the current one. It is listed under Prior-period adjustments.
A banner reports entries pending market assignment. Some orders have not yet been matched to a market and are excluded from the totals until they are. Contact support if the banner does not clear.
Money appears to be missing. Amounts still owed are outstanding, not missing. See Managing Your Receivables.
FAQs
An order is confirmed but unpaid. Is it counted as a sale?
Yes. The sale is recorded on the date the price was confirmed. Whether payment has been received is tracked separately, under Reports, then Payments, or in Receivables.
Why is a B2B agent order dated differently from a normal order?
Agent orders are recorded on the order date, because that is the date shown on the invoice issued to the agent. All other orders are recorded on the date their price was confirmed.
I changed the price on a confirmed order, but sales moved only slightly. Why?
Only the difference is recorded. The original sale remains on its original date, and an adjustment for the difference is recorded on the date of the change. The date the sale was made is never rewritten.
I received payment on an older order. Why did today's sales not increase?
A payment is not a sale. The sale was recorded when the price was confirmed. The payment appears on the Payments report.
Why can a figure in a closed month not be corrected?
That is the purpose of closing a period. Process the correction as normal and it is recorded in the current period, listed under Prior-period adjustments with the original sale date shown alongside. Where an accountant must genuinely restate a filed month, see Managing Sales Periods.
I cancelled a confirmed order. What happens to the figures?
A cancellation entry is recorded, offsetting the original sale, and Net Sales reduces accordingly. If the original sale falls in a closed period, the cancellation is recorded in the current one.
A sales return was issued in error and voided. Is the sale restored?
Yes. The amount is added back on the date of the void, not on the date of the original return.
Some tables appear in one month and not another. Is this a fault?
No. Each table appears only where it has data to present, and filtering to a single sales channel withholds the channel comparison tables. See "Why a Table May Not Appear" above.
The export does not match what is shown on screen. Why?
Check the export date range, whether a sales channel or location filter was applied on screen, and whether the export was requested before a late correction was recorded. The export is a snapshot taken at the time of the request; the page on screen is live.
A staff member cannot open the Sales Report. What is required?
Sales report data permission on their profile. On accounts using seat-based access, an admin seat is also required.
I created a Redo Order for a customer at no charge. How does it show on this report?
A redo order is a real order carrying an automatic 100% Redo Discount, so it adds nothing to Net Sales. It does count in Orders, it appears in Gross Sales and Discounts as equal and opposite amounts, and it shows in Discount Breakdown as a Redo Discount line. Because it adds an order worth nothing, it pulls Avg Order Value down, where it is expected, not an error. See Processing Sales and Orders.
What's Next
You now know what each figure on the Sales Report represents and which date each sale is recorded under. The next step is to protect those figures once a month is complete, so that a filed month cannot be altered — see Managing Sales Periods. To process a return before closing, see Processing Refunds and Returns.