
Before you start
- You need the Sales or CRM product on your Full seat to open this report. The account owner always has it. See Giving Your Staff Access to Reports if a staff member can't find it.
- A contact is anyone saved in your customer list: a walk-in customer, a regular, or someone who signed up on your online store.
- This report only counts contacts who placed an order in the period you pick. Orders taken without a contact attached are not counted.
What the Contacts Report tells you
The Contacts Report shows how many people bought from you in a month or a year. It splits them into two groups:
- New contacts: people you added to your customer list in this period, who also ordered in it.
- Returning contacts: people who were already in your customer list before this period and ordered again.
It helps you answer simple questions. Is my shop getting new customers? Are my regulars coming back? Did my last promotion bring in anyone new?
Without it, you only see your sales total. Sales can look fine while fewer people are actually coming in, because a few big orders hide the drop. This report shows you the people behind the money.
Open the Contacts Report
- In the top menu bar, click Reports.
- Click Contacts.
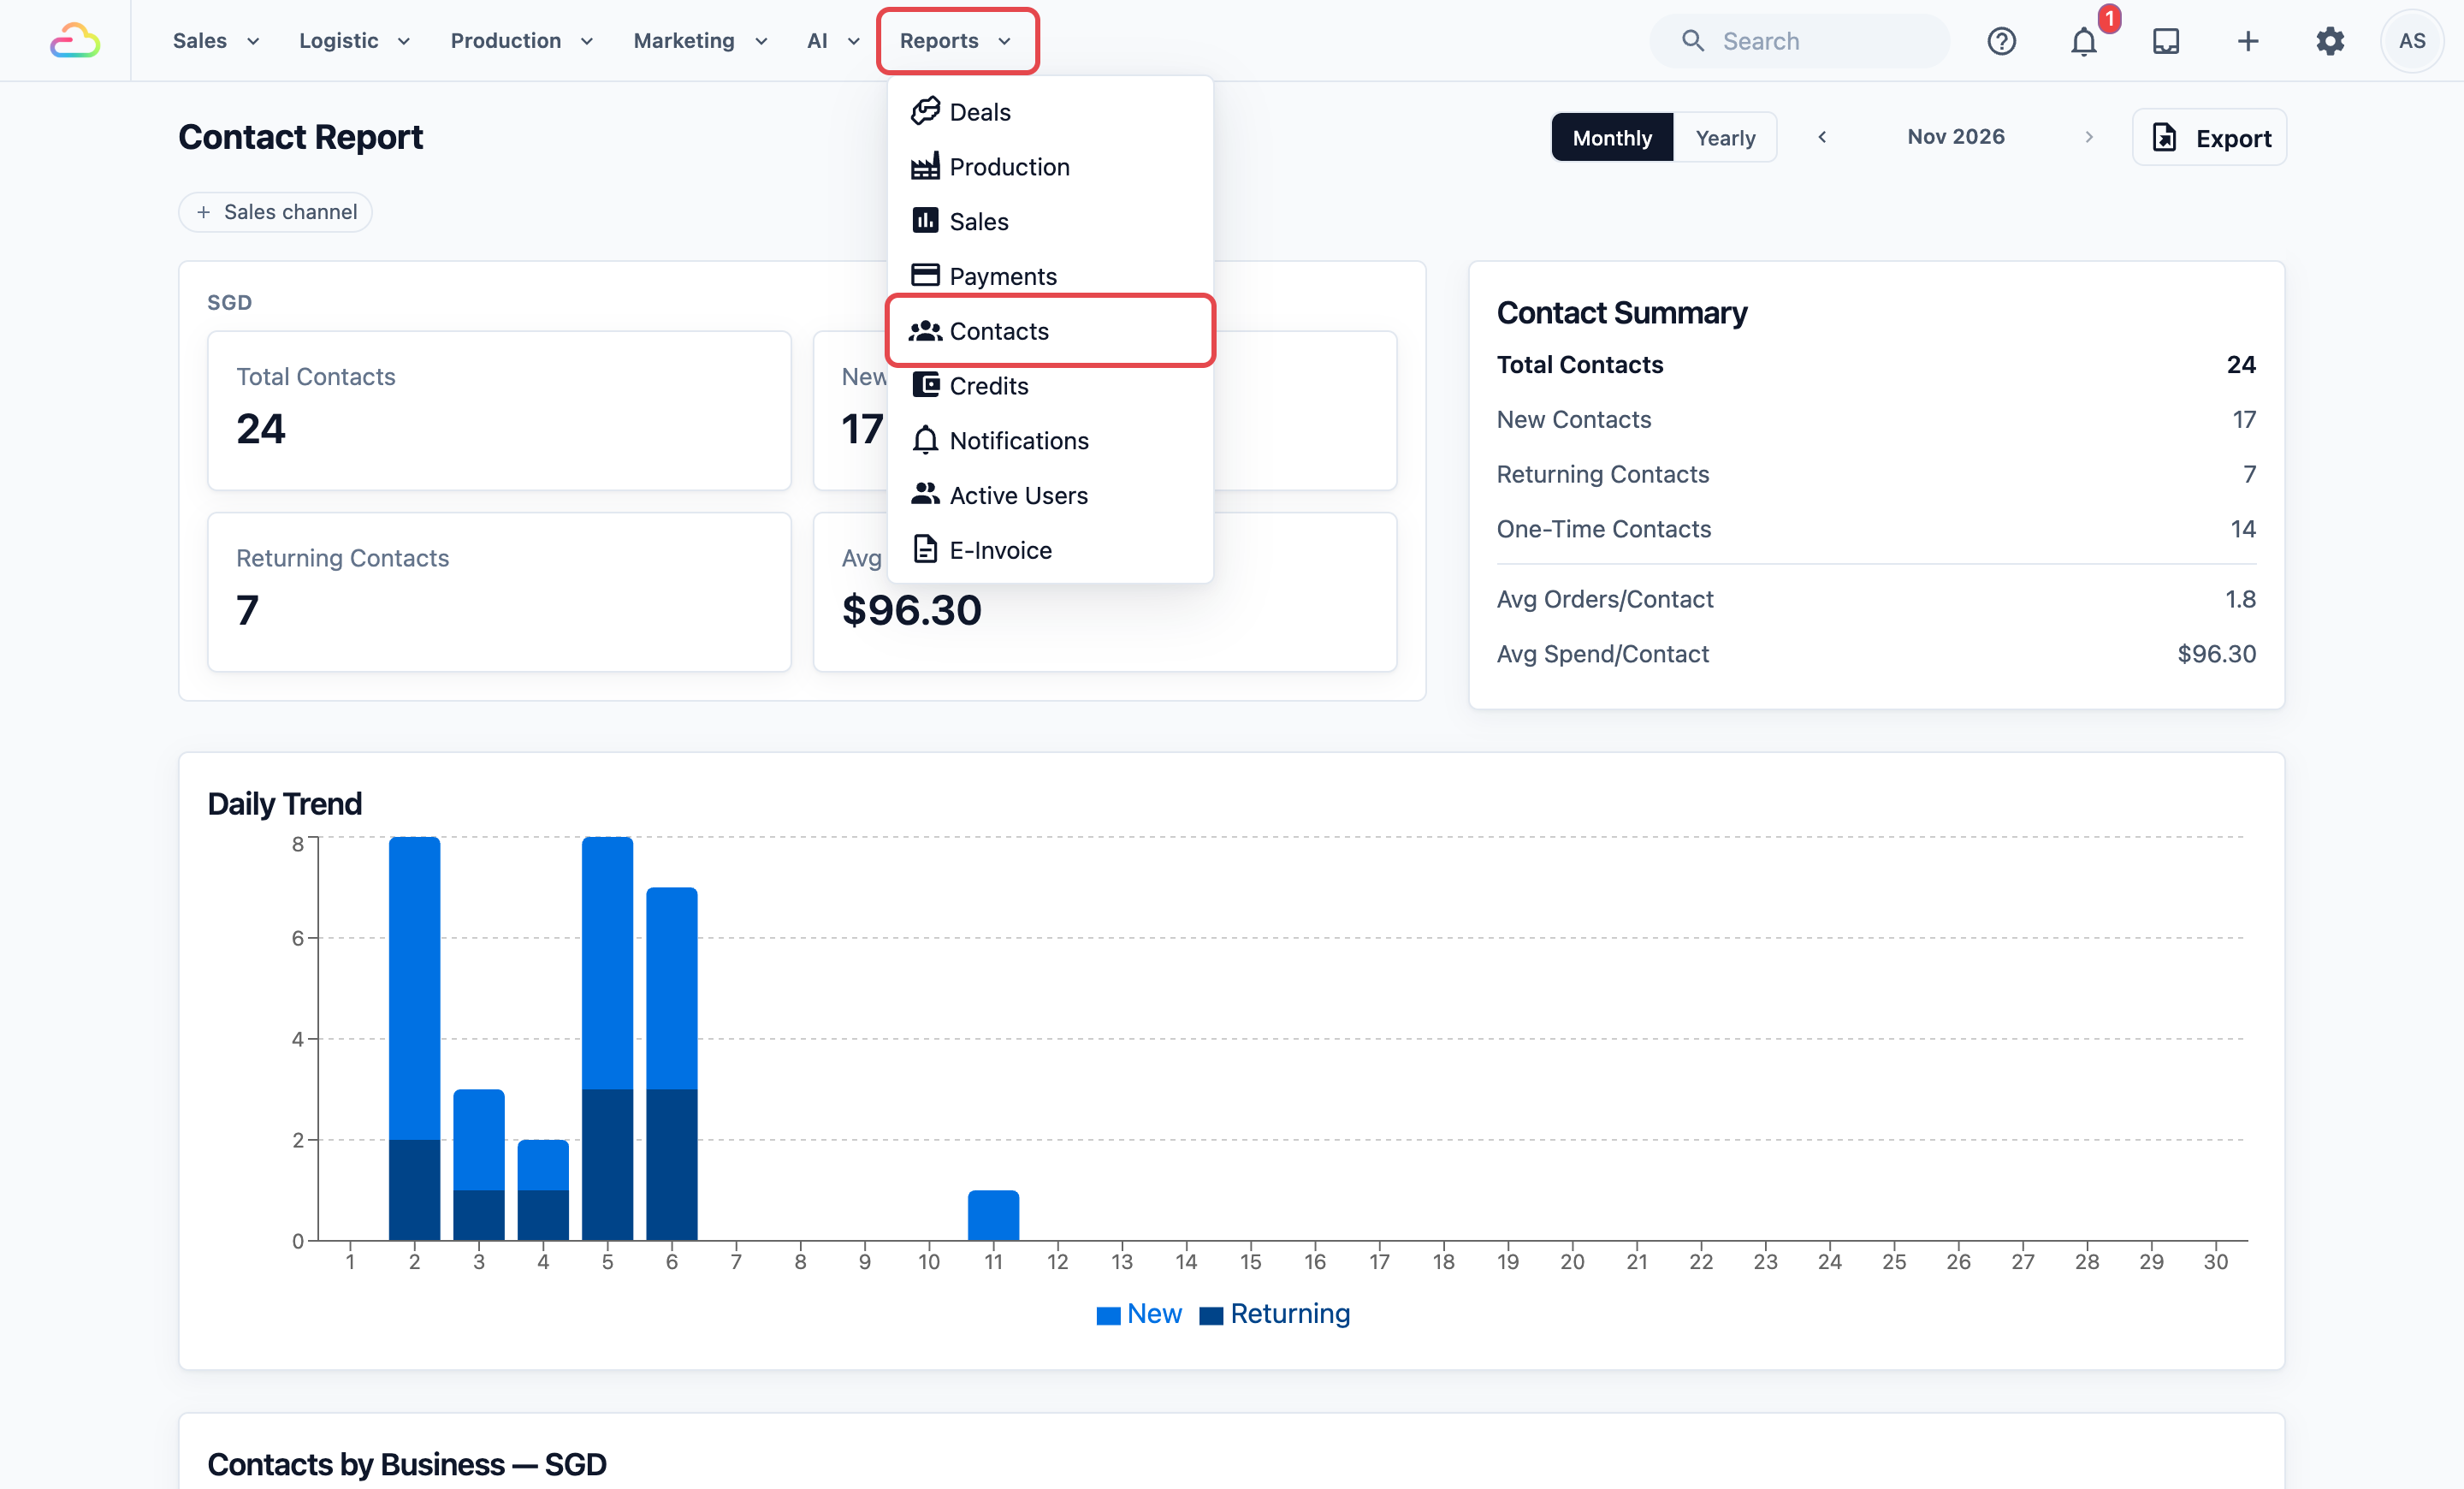
The Contact Report page opens on the current month.
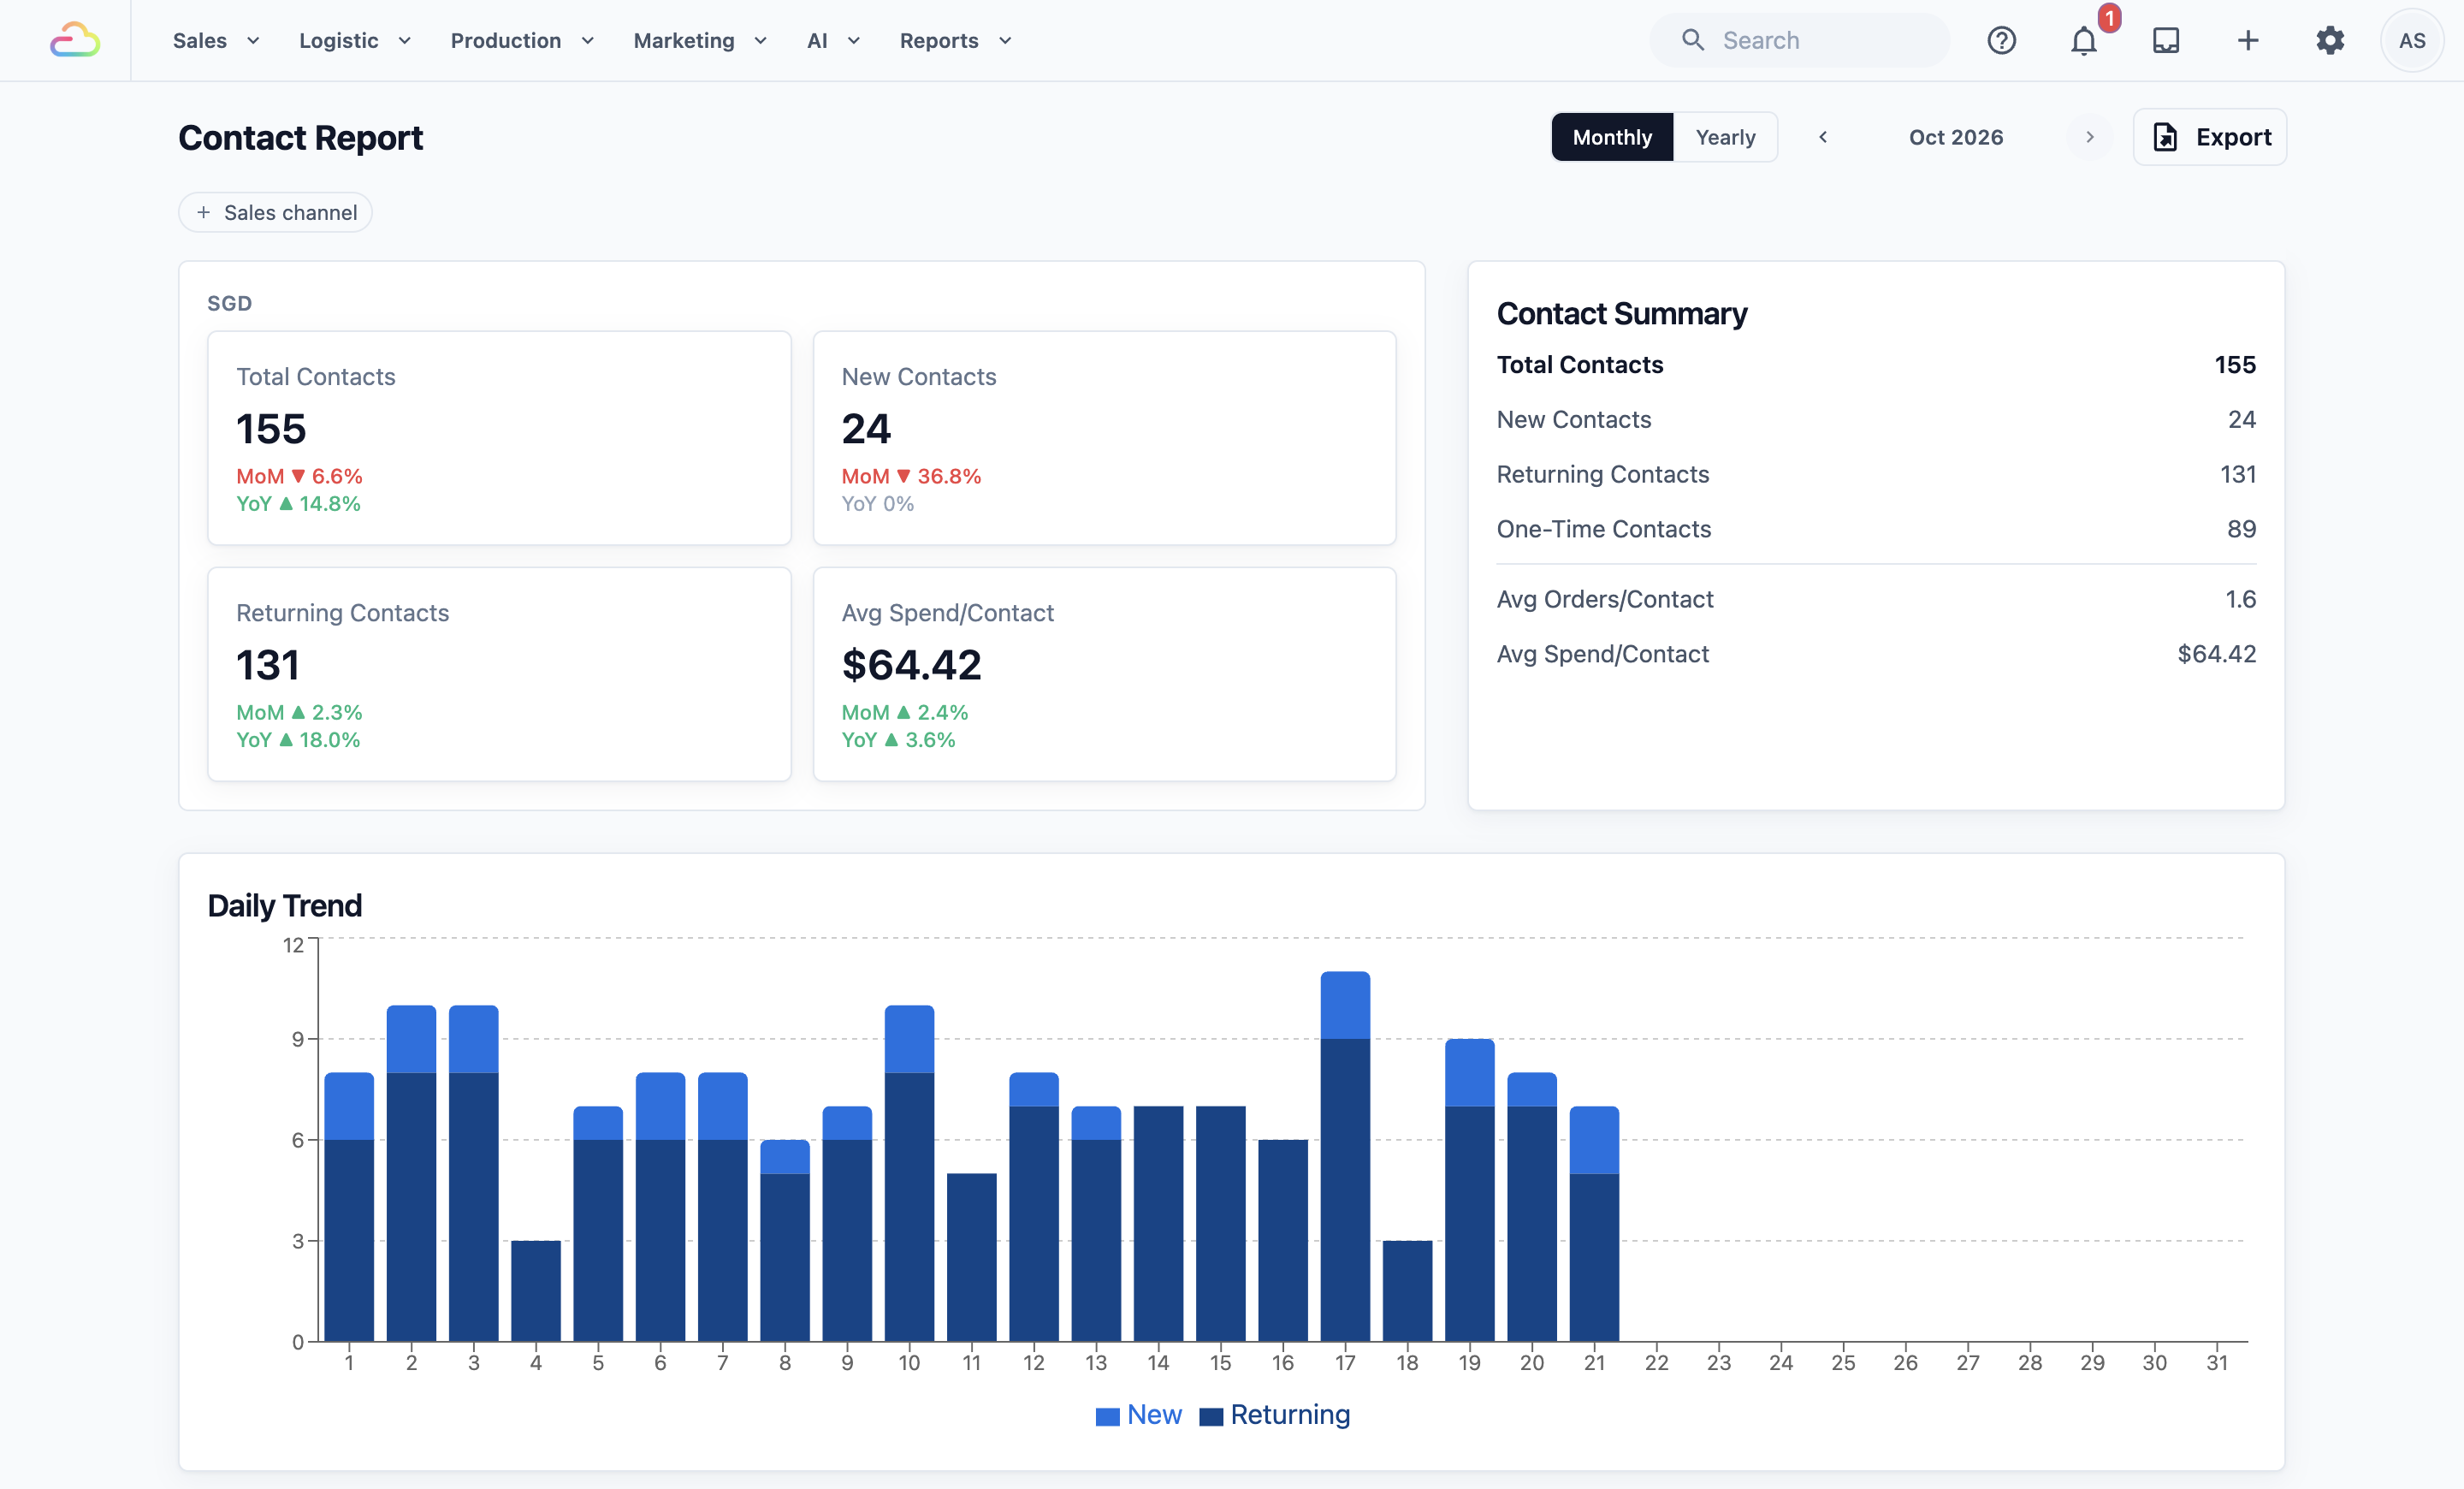
- To see another month, click the left or right arrow next to the month name, such as Sep 2026. You can't move past the current month.
- To see a whole year, click Yearly. Click Monthly to go back.
- To see one outlet only, click the Sales channel filter above the report and choose the outlet. A sales channel is any place you take orders, such as an outlet or your online store. Click Clear to see all outlets again.
You can also save this report as an Excel file with Export. See Export this report.
Read the monthly view
The page has five parts, from top to bottom.
The four cards
- Total Contacts: everyone who ordered this month.
- New Contacts: people added to your customer list this month who also ordered.
- Returning Contacts: people from before this month who ordered again.
- Avg Spend/Contact: your sales this month divided by Total Contacts.
Under each number, MoM compares it with last month and YoY compares it with the same month last year. A green ▲ means it went up. A red ▼ means it went down.
The Contact Summary card It repeats the four numbers and adds two more:
- One-Time Contacts: people who ordered only once this month.
- Avg Orders/Contact: how many orders each person placed this month, on average.
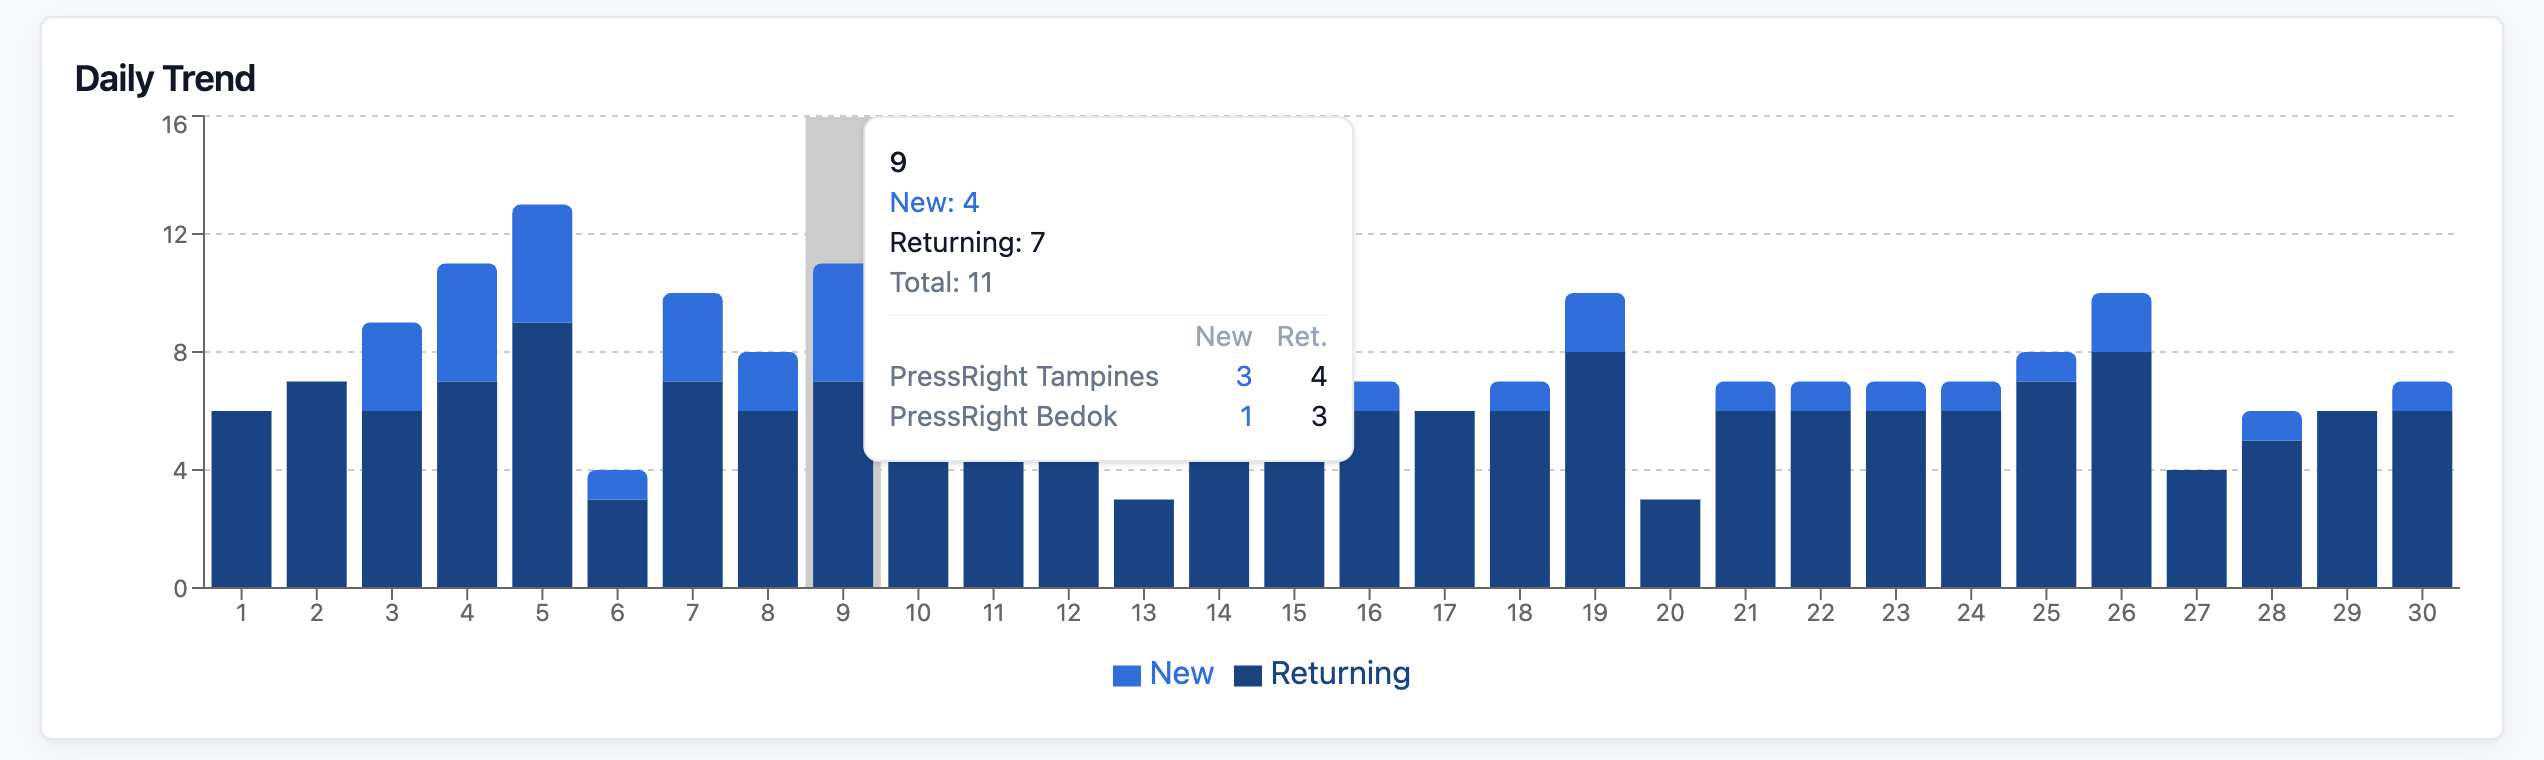
The Daily Trend chart Each bar is one day. Each bar has two colours: one for New and one for Returning, as the legend under the chart shows. Hover over a bar to see the exact numbers for that day. If you have more than one outlet, the pop-up also splits them by outlet.
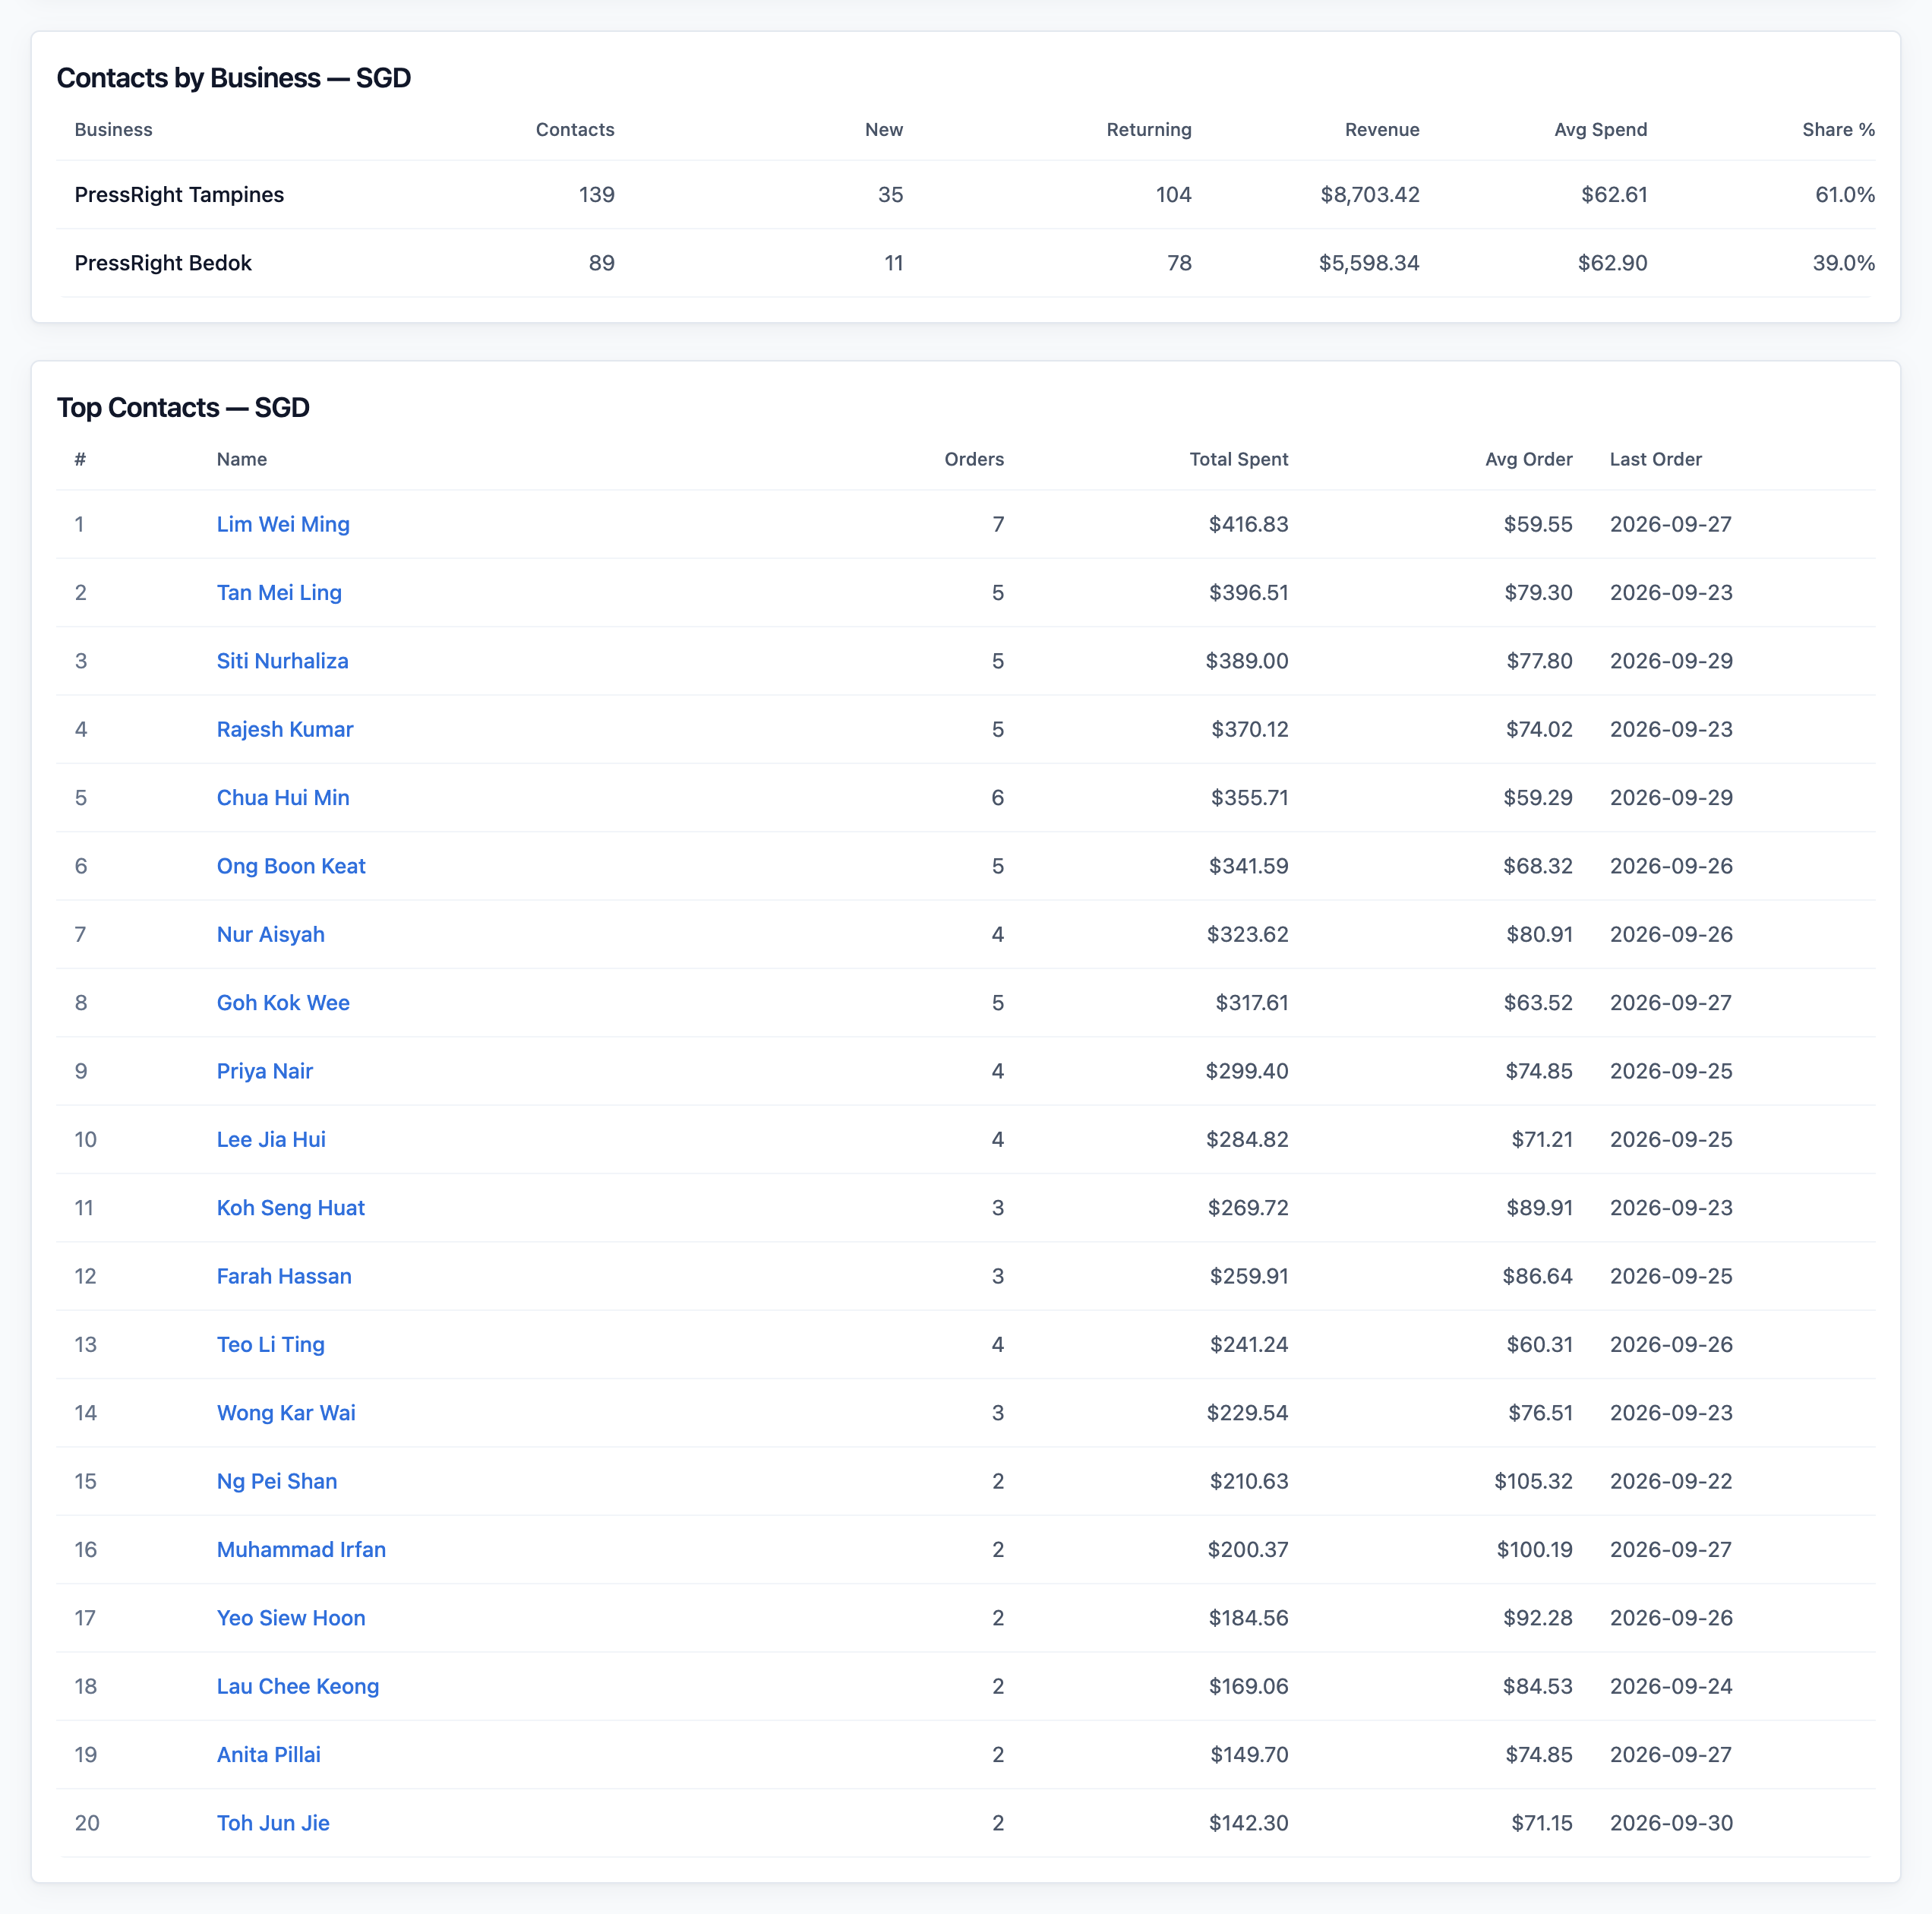
The Contacts by Business table It shows each outlet in its own row, with its Contacts, New, Returning, Revenue, Avg Spend and Share %. Share % is that outlet's part of all your contacts. This table hides when you filter by one sales channel.
The Top Contacts table It lists your 20 biggest spenders this month, with their Orders, Total Spent, Avg Order and Last Order date. Click a name to open that contact's page. This table also hides when you filter by one sales channel.
Read growth over the year
- Click Yearly.
- Use the arrows to choose the year.
The cards now show the whole year, with YoY comparing it to last year. The chart changes to Monthly Trend, with one bar for each month.
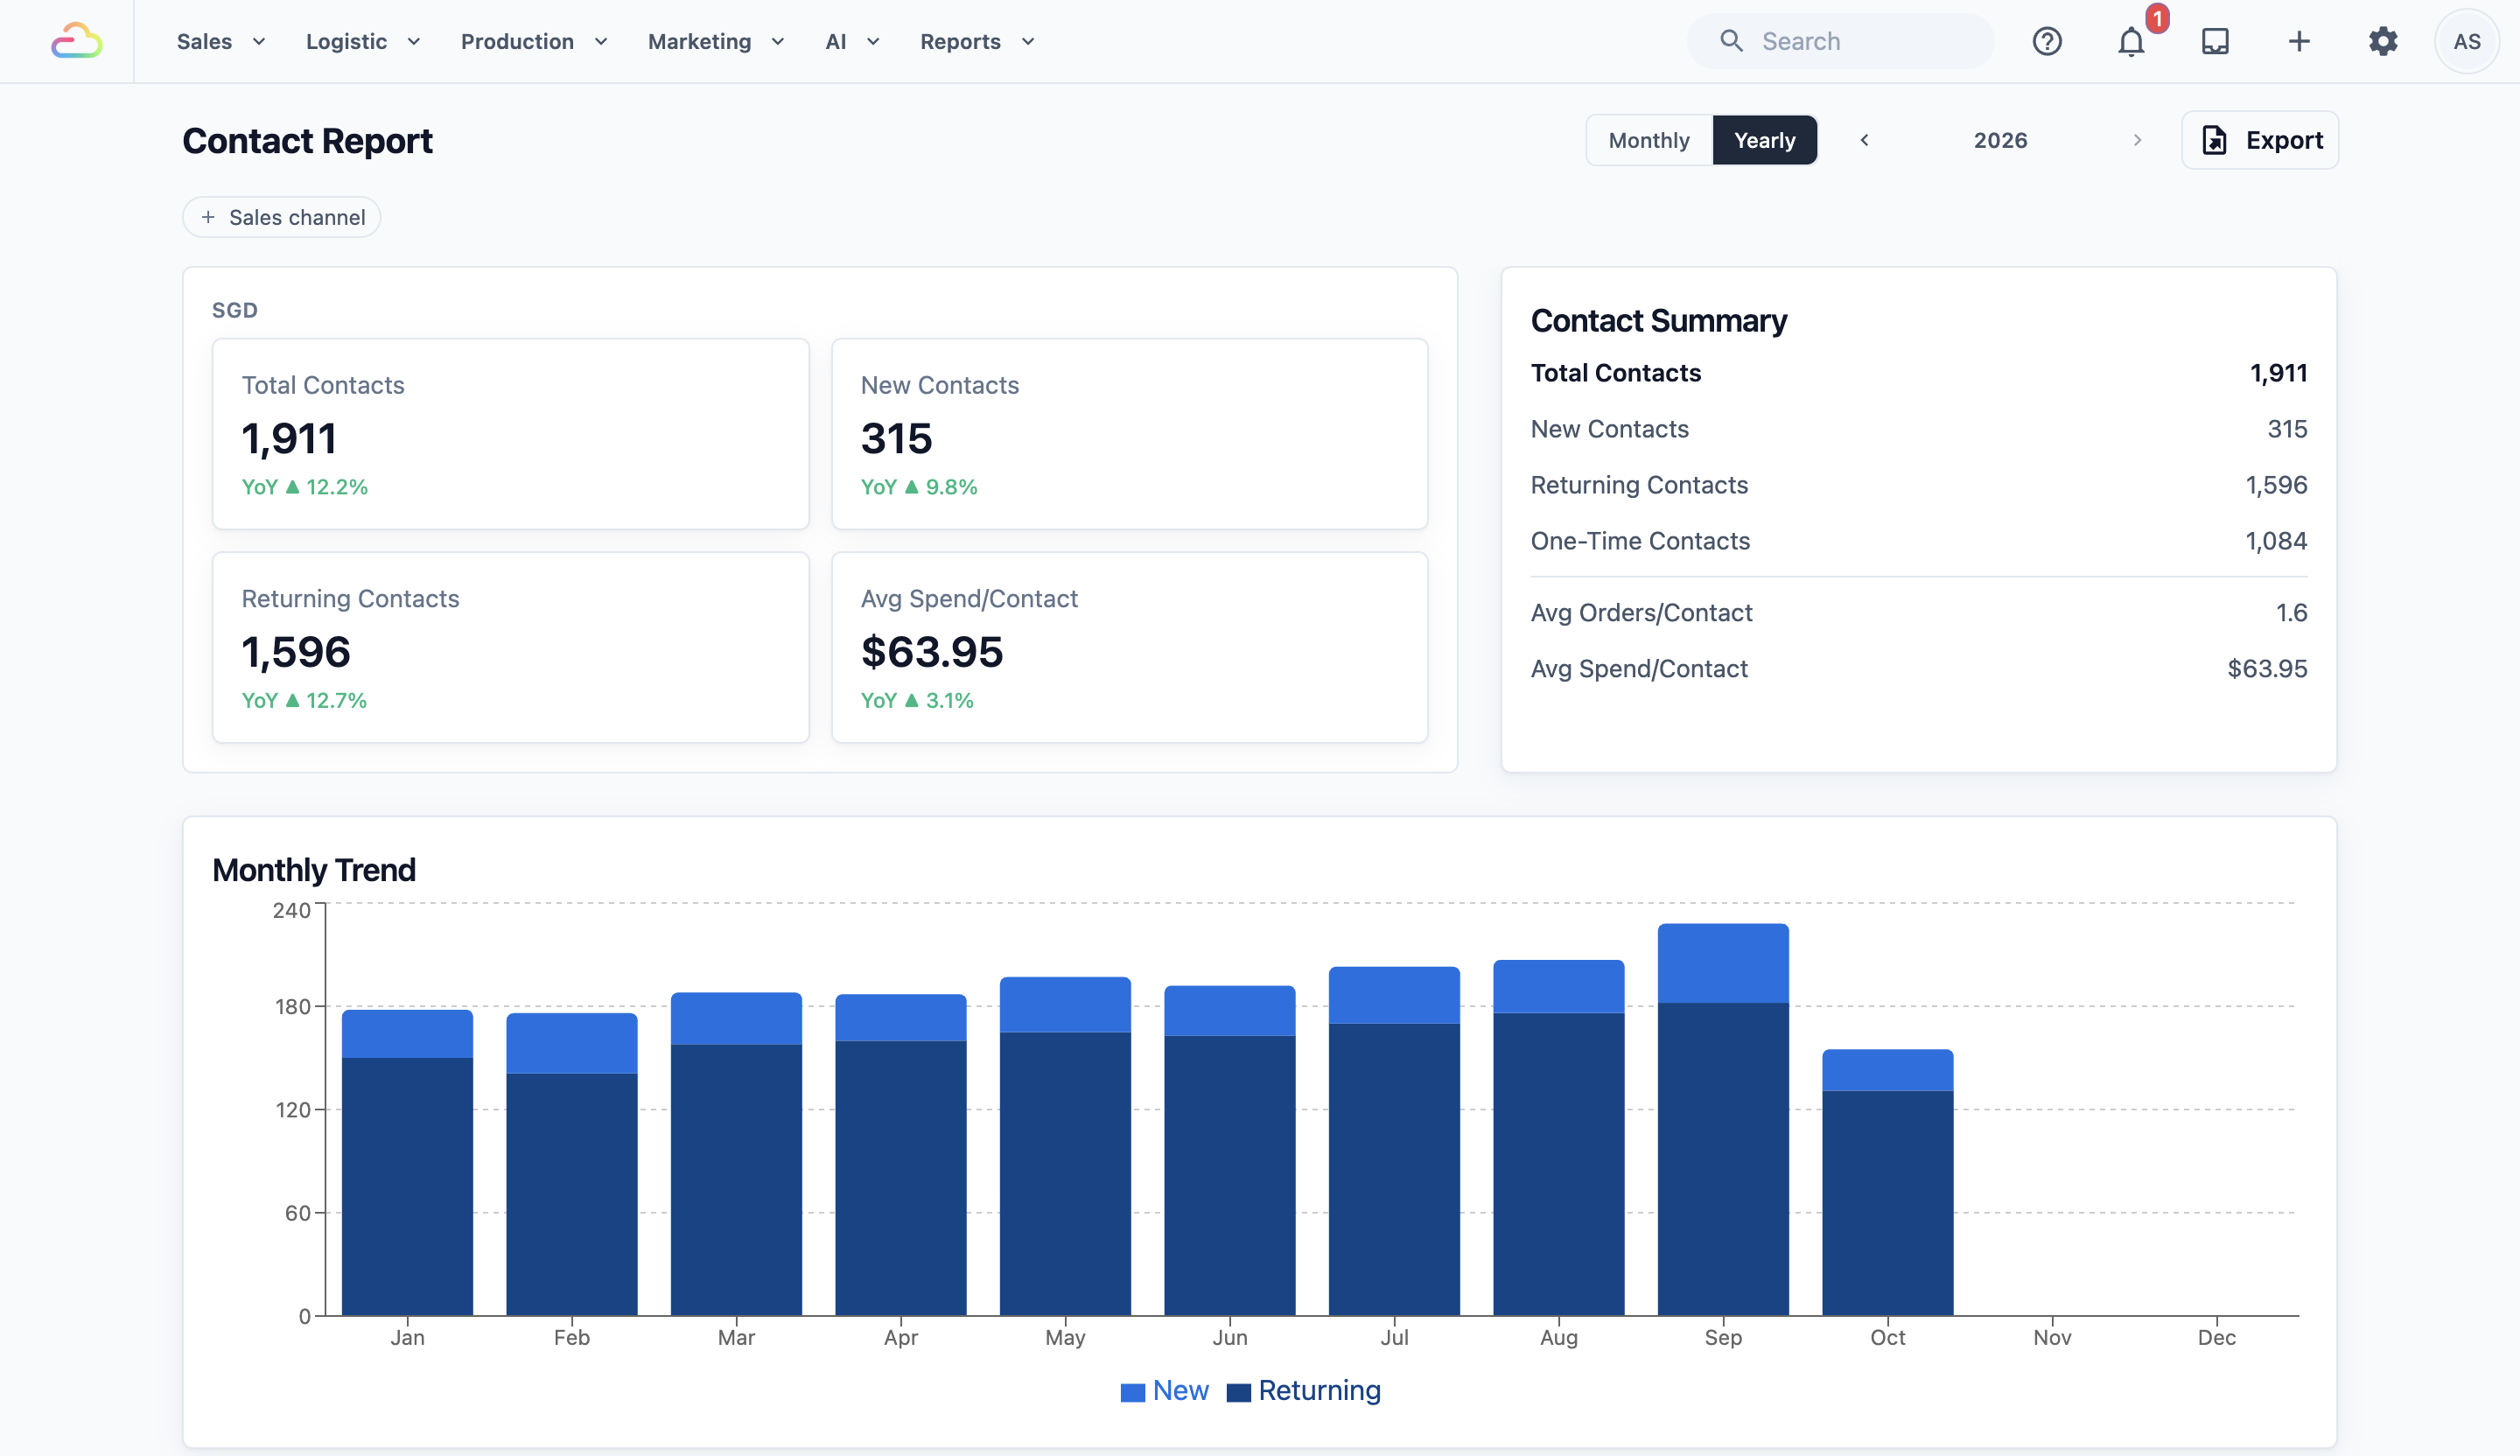
Look at the shape of the bars:
- New contacts growing: your shop is reaching more people.
- Returning contacts steady or growing: your regulars are happy and coming back.
- New contacts high but returning contacts flat: people try you once and don't come back. Check your service or follow up with them.
- Both falling: time for a promotion or a reminder to your regulars.
Link it to your promotions
The report doesn't know which promotion brought each person in. You can still see the effect by comparing periods.
- Note the dates your promotion ran, such as a flyer drop or a discount week.
- Open the month of the promotion in Monthly view.
- Look at the MoM change on New Contacts. A clear jump means more new people came in than last month.
- Look at the Daily Trend chart. Taller New parts of the bars in the days after your promotion show when the new people came in.
- If the promotion was for one outlet, use the Sales channel filter or the Contacts by Business table to check that outlet.
- Open the next month. If many of those new people show up as returning contacts, your promotion found customers who stay.
Export this report
Export the Contacts Report when you want the people behind the numbers, for example to thank your 20 biggest spenders or to keep a list of the new customers a promotion brought in.
- Set the report to the month or year and the sales channel you want.
- At the top right, click Export.
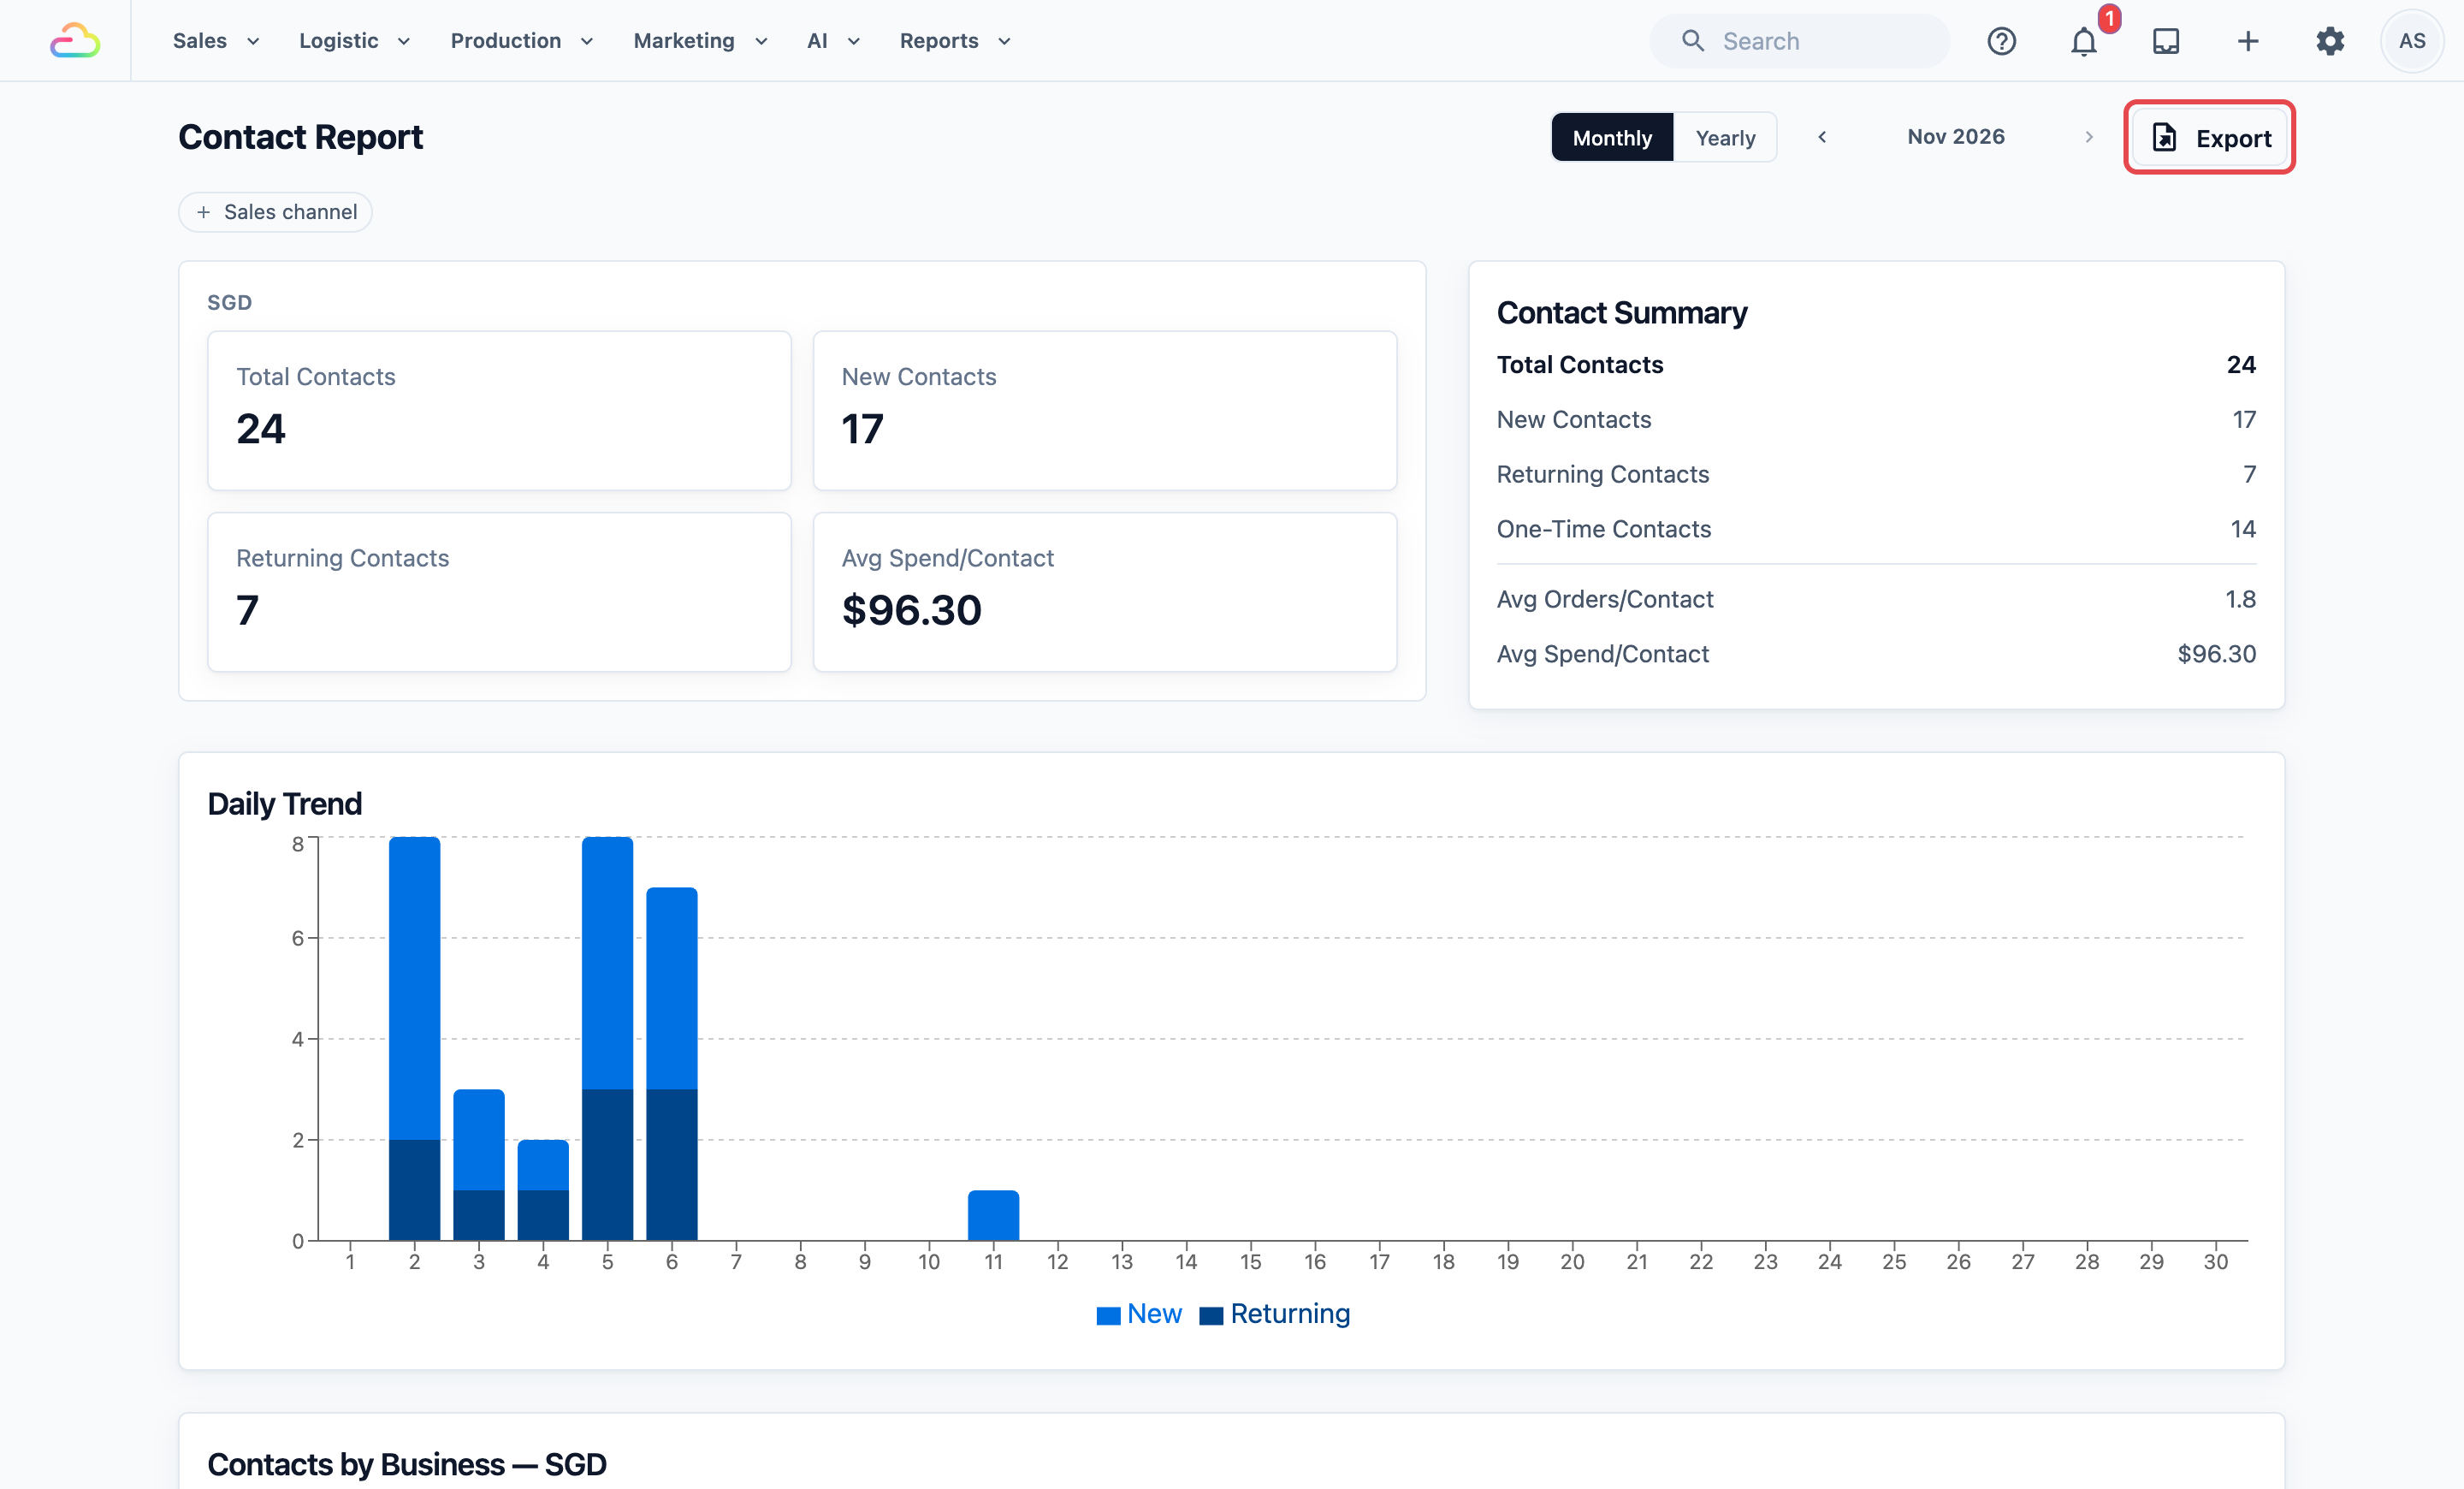
The Export Contact Report window opens.
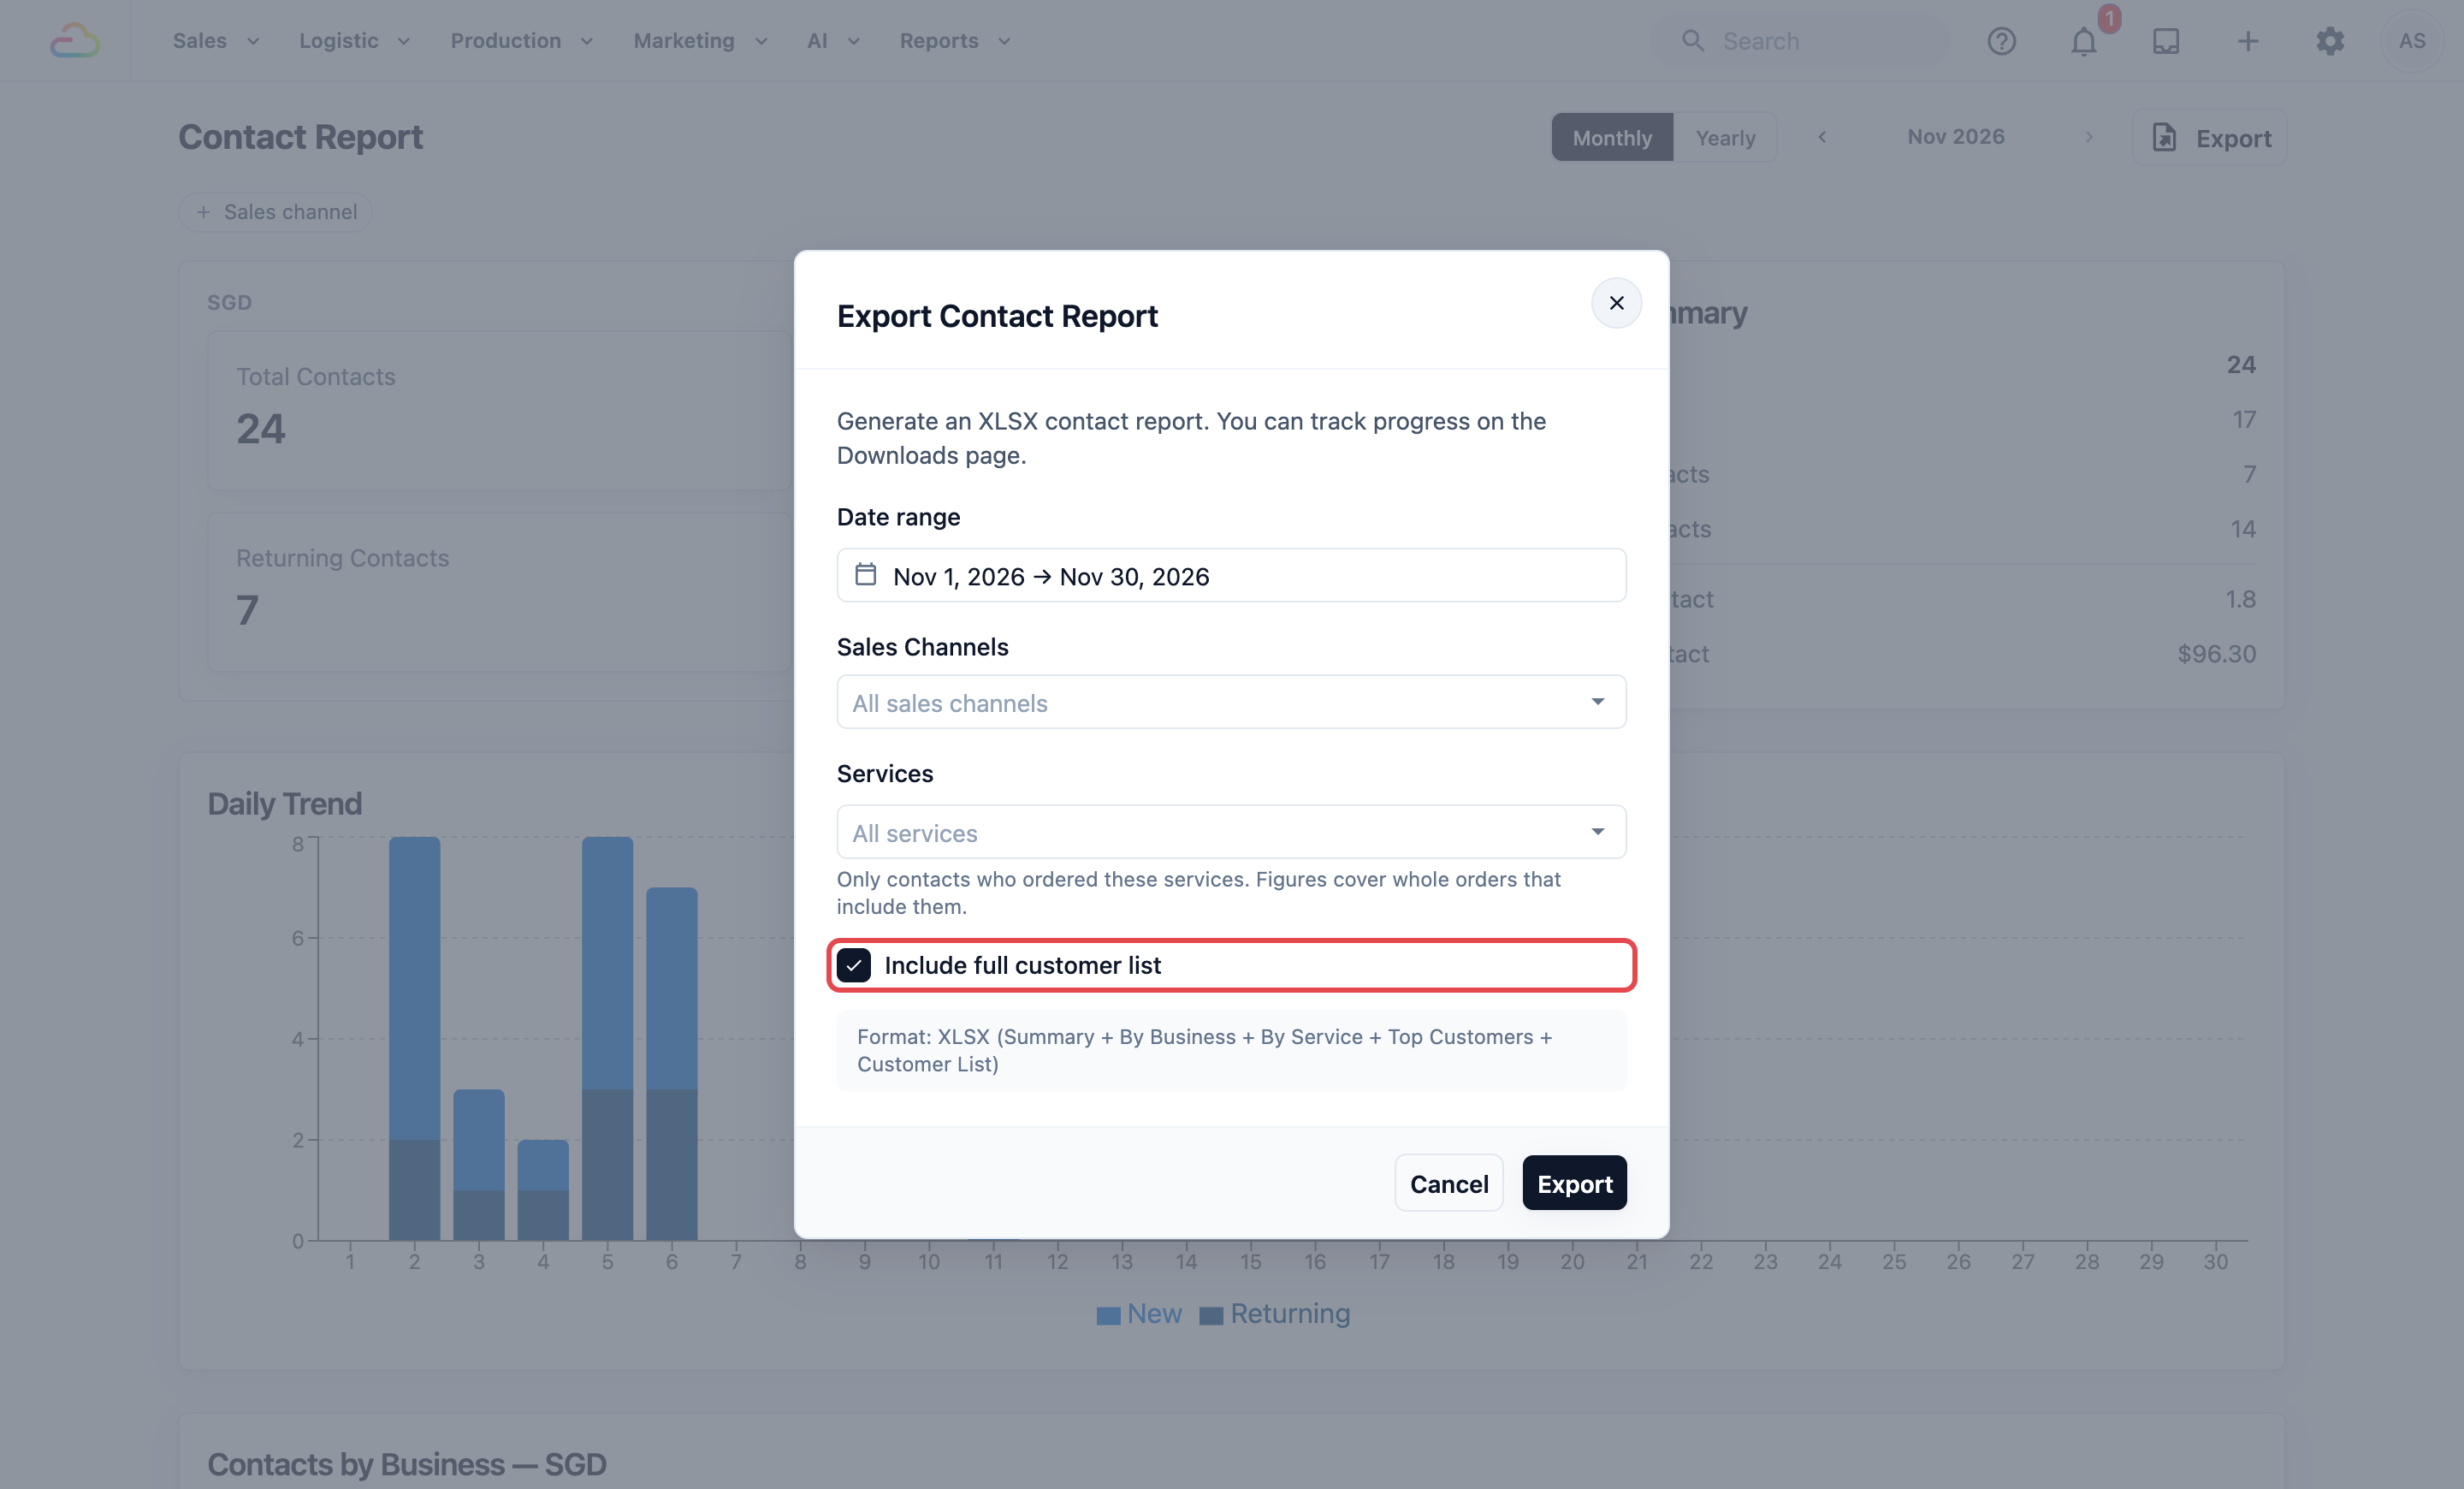
- Check the Date range. It starts with the month on the page in Monthly view, or the whole year in Yearly view. Change it here if you need other dates, for example the three months of a promotion.
- Under Sales Channels, keep the sales channel you picked on the page, leave All sales channels, or pick one or more.
- Use Services only if you want the people who ordered a certain service, for example Dry Cleaning. It always starts at All services, and it only appears when your shop has service options set up. The note under it reminds you that the figures cover the whole orders that include those services, not only those items.
- Tick Include full customer list if you want everyone who ordered in those dates, not only the top 20.
- Read the grey box under the options. It shows Format: XLSX (Summary + By Business + By Service + Top Customers), and adds + Customer List when the box is ticked.
- Click Export.
When Export ready shows under the button, click Download. The file is also kept on your Downloads page. See Exporting to Excel and Downloads.
What carries over from the page
| Filter on the page | In the export |
|---|---|
| Period (Monthly or Yearly) | Fills in the Date range. You can change it in the window |
| Sales channel | Fills in Sales Channels. You can change it in the window |
What's in the file
The file has these sheets. A sheet with nothing to show is left out.
| Sheet | What it shows |
|---|---|
| Summary | The period and any services you picked, then for each currency: Total Customers, New Customers, Returning Customers, One-Time Customers, Orders, Revenue, Avg Spend/Customer and Avg Orders/Customer |
| By Business | Each sales channel with its Total Customers, New, Returning, One-Time, Orders and Revenue |
| By Service | Each service, product and service option your customers ordered in those dates, with Contacts, Orders, Qty and Net Sales |
| Top Customers | Your 20 biggest spenders, with New/Returning, Orders, Spend, Avg Order and Last Order |
| Customer List | Only when the box is ticked. Everyone who ordered in those dates, with their phone, the date they joined your customer list, Last Order, New/Returning, Orders, Spend, the services they ordered in the period and their top services of all time |
You can export up to one year (366 days) at a time. With Include full customer list ticked, the limit is 92 days. The window shows a red message when your dates are too long.
Example: PressRight checks its flyer campaign
PressRight Laundry has outlets in Tampines and Bedok. In the first week of September, the owner, Mr Tan, put flyers in the letterboxes of the HDB blocks near the Tampines outlet. On 1 October, he checks if it worked.
- He clicks Reports, then Contacts.
- He clicks the left arrow once to open Sep 2026.
- New Contacts shows 46, with MoM ▲ 48.4% and YoY ▲ 21.1%. In August, only 31 new people ordered.
- In the Daily Trend chart, the New part of the bars is tallest from 3 to 12 September, just after the flyers went out.
- In the Contacts by Business table, Tampines has 35 of the 46 new contacts. Bedok looks like a normal month.
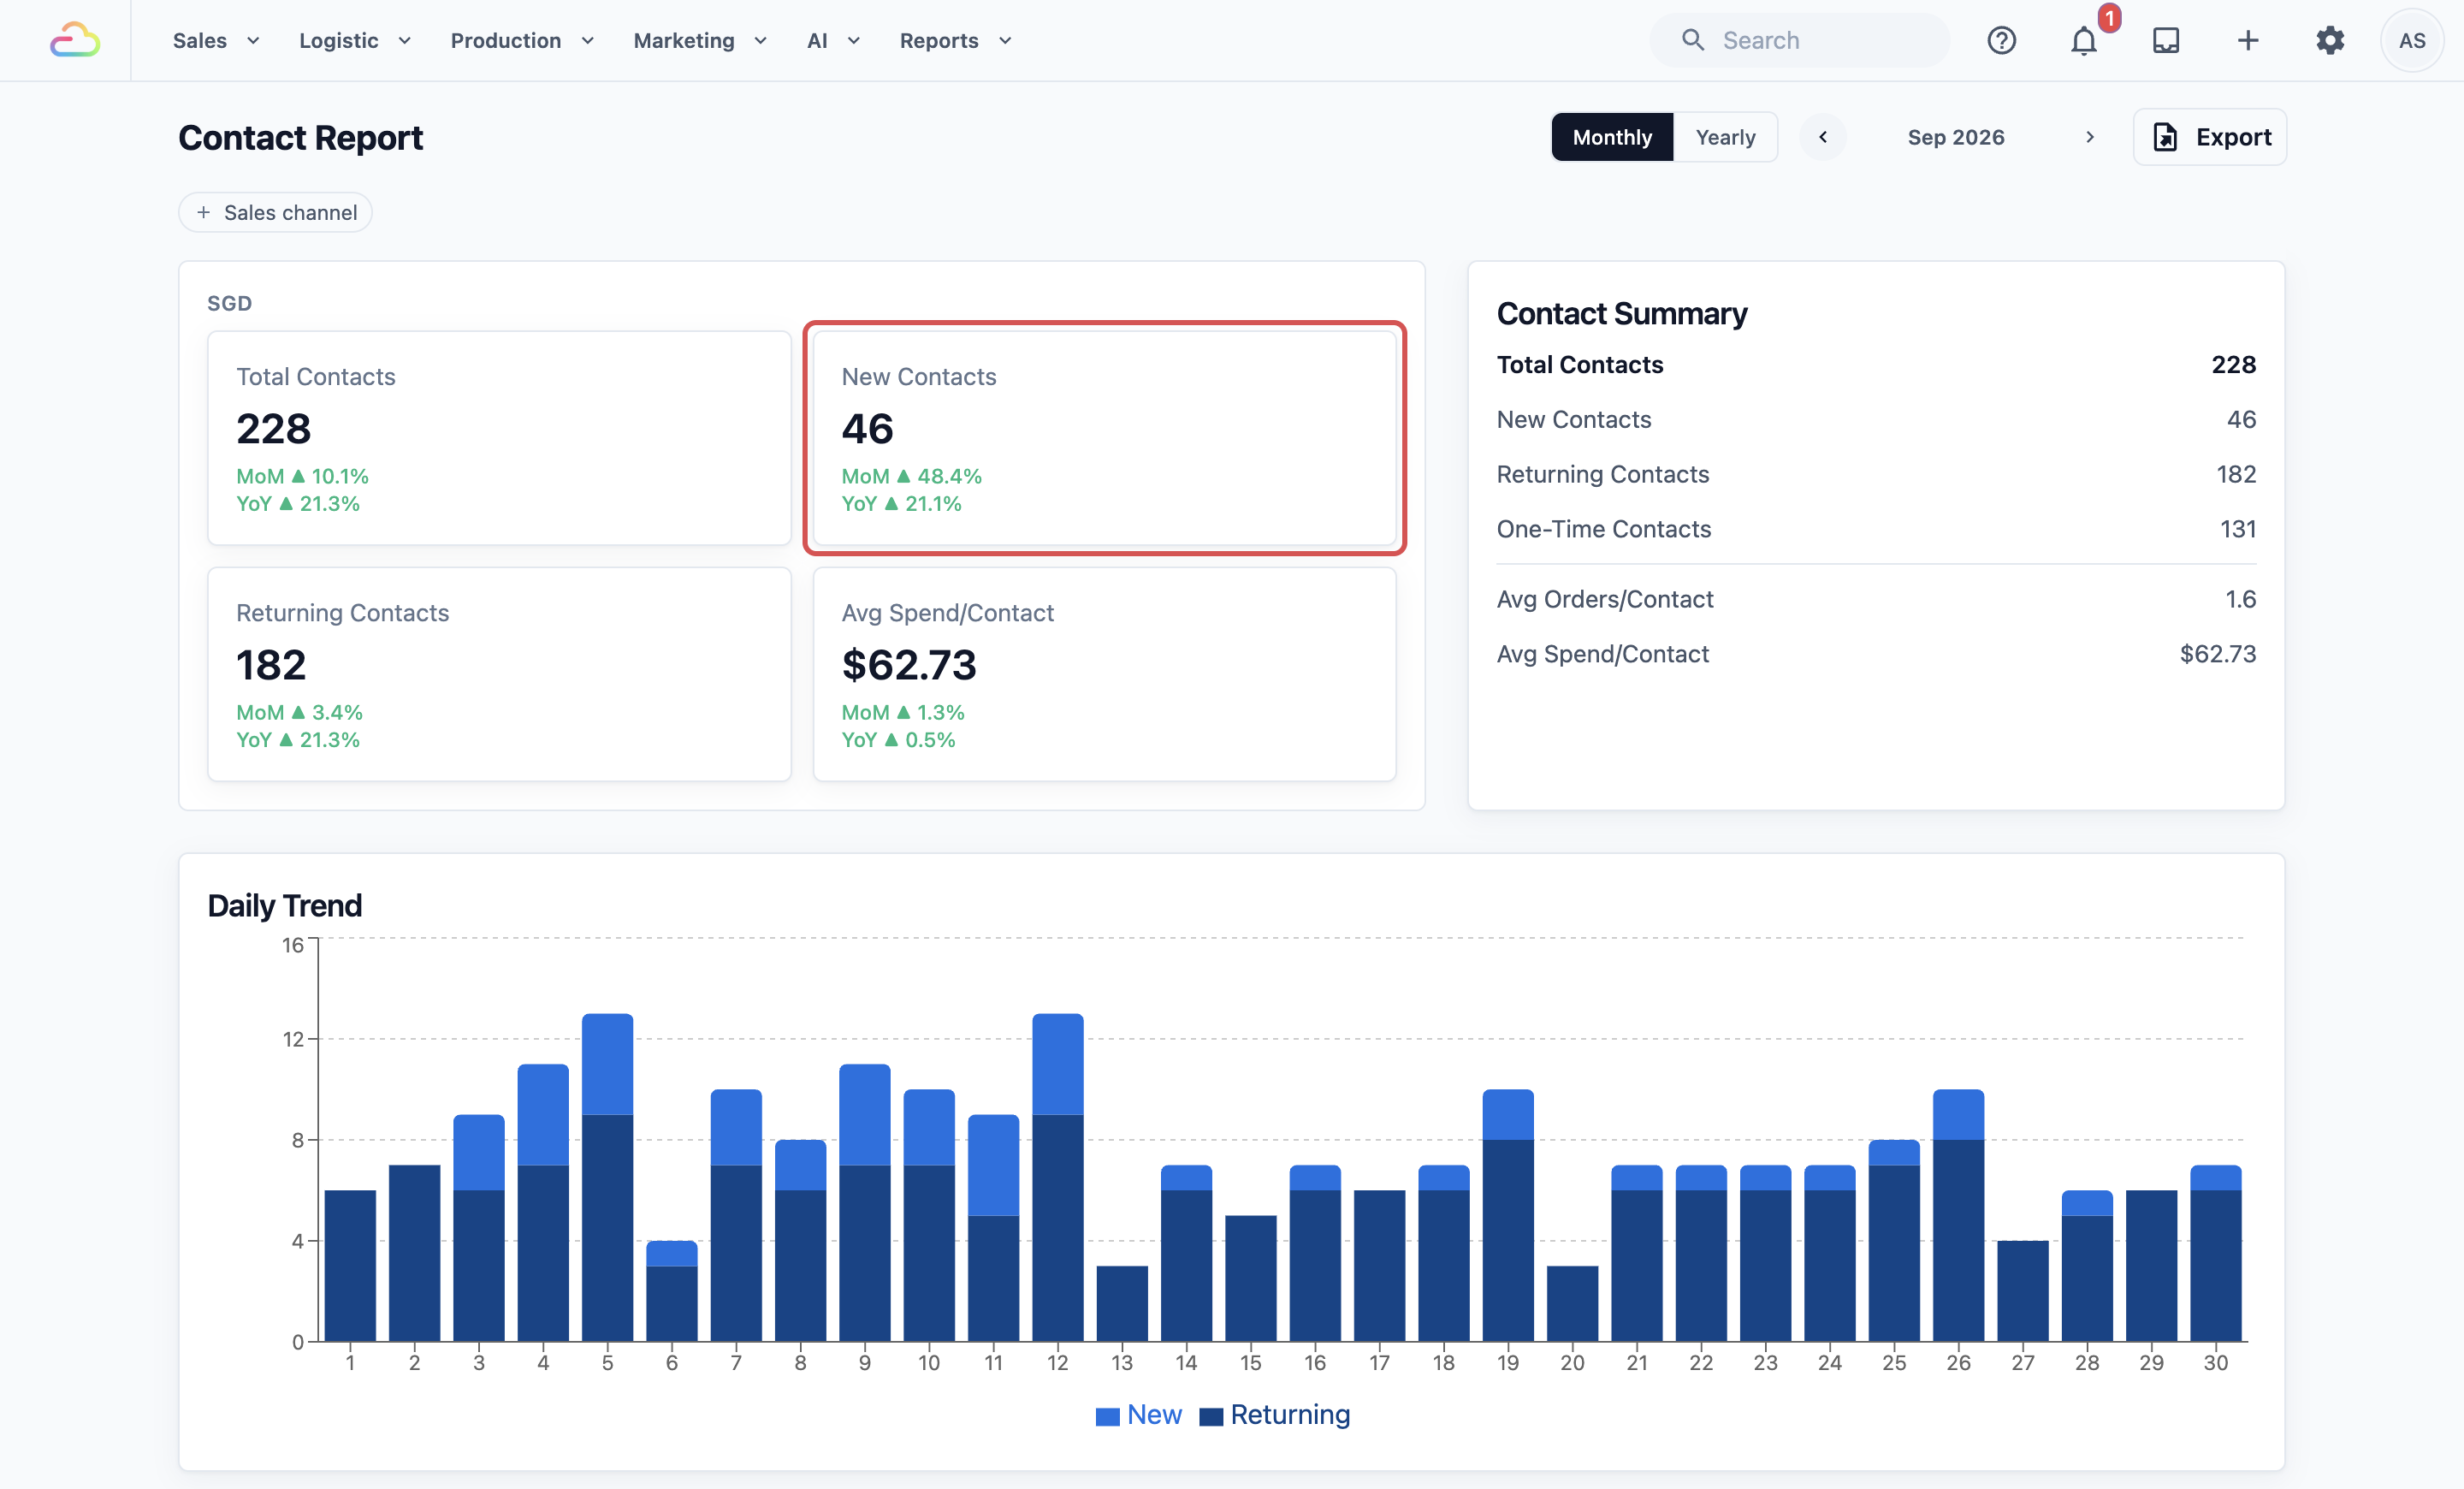
Mr Tan knows the flyers worked, and where. He plans to check October next month. If many of September's new customers come back as returning contacts, he will print flyers for Bedok too.
FAQs
Does a merged contact count twice?
No. When you merge two contacts, all their orders move to the contact you keep, and the report recounts those months. The person counts once. Whether they show as new or returning follows the date the kept contact was first added to your customer list.
Are Online Store sign-ups included?
Only when they order. Signing up on your online store adds the person to your customer list, but the report counts people who ordered. If someone signs up in March and first orders in May, they count as a returning contact in May, because they joined your list before May.
Why is my yearly Total Contacts higher than the number of customers I have?
The yearly figures add up the 12 months. A regular who ordered in 10 different months counts in each of those months, so they add 10 to the yearly Total Contacts and Returning Contacts. Use the yearly view to compare one year with another, not to count people.
Why does last month look smaller when I check the current month?
For a fair comparison, MoM and YoY only use the same number of days. On 15 October, October is compared with 1 to 15 September, not the whole of September. Once the month ends, the full months are compared.
Why are some of my walk-in orders not in this report?
The report only counts orders linked to a contact. If your staff take an order without choosing or adding a customer, it still counts in your Sales Report, but not here. Ask your staff to attach a contact to every order if you want this report to be complete.
Why do I see two sets of cards?
If your outlets sell in two currencies, for example SGD in Singapore and MYR in Malaysia, the report shows one set of numbers for each currency. This keeps the spending figures correct.
Why did my export fail when I picked a service?
If nobody ordered the services you picked in those dates, there is nothing to export. The file shows as Failed on your Downloads page with a message such as "No contacts ordered Dry Cleaning in this period." Pick other dates or services and export again.
What's next
Continue to Reading the Credits Report to see how much store credit your customers hold and use.