
Before You Start
Make sure you have:
- Access to the Sales Report. If Sales is missing from your Reports menu, your account does not have it yet. See Report Access for Staff.
- A basic feel for choosing a period and filters. See Report Periods and Filters.
What the Sales Report Is
The Sales Report is your shop's sales book. It adds up every order your shop has sold and shows the money by day, month or year.
A sale is the value of the work you agreed to do for a customer. It is not the cash you collected. A customer who has not paid yet still counts as a sale. Cash collected lives in the Payments Report.
The Sales Report helps you decide things like:
- Which days need more staff at the counter.
- Whether this month is better or worse than last month.
- Which sales channel (a place where you take orders, such as your shop counter, your app or a mall outlet) brings in the most money.
Without it, you only see one order at a time. You would have to guess which days are busy and whether your discounts and returns are eating into your sales.
Open the Sales Report
- In the top menu, click Reports .
- Click Sales .
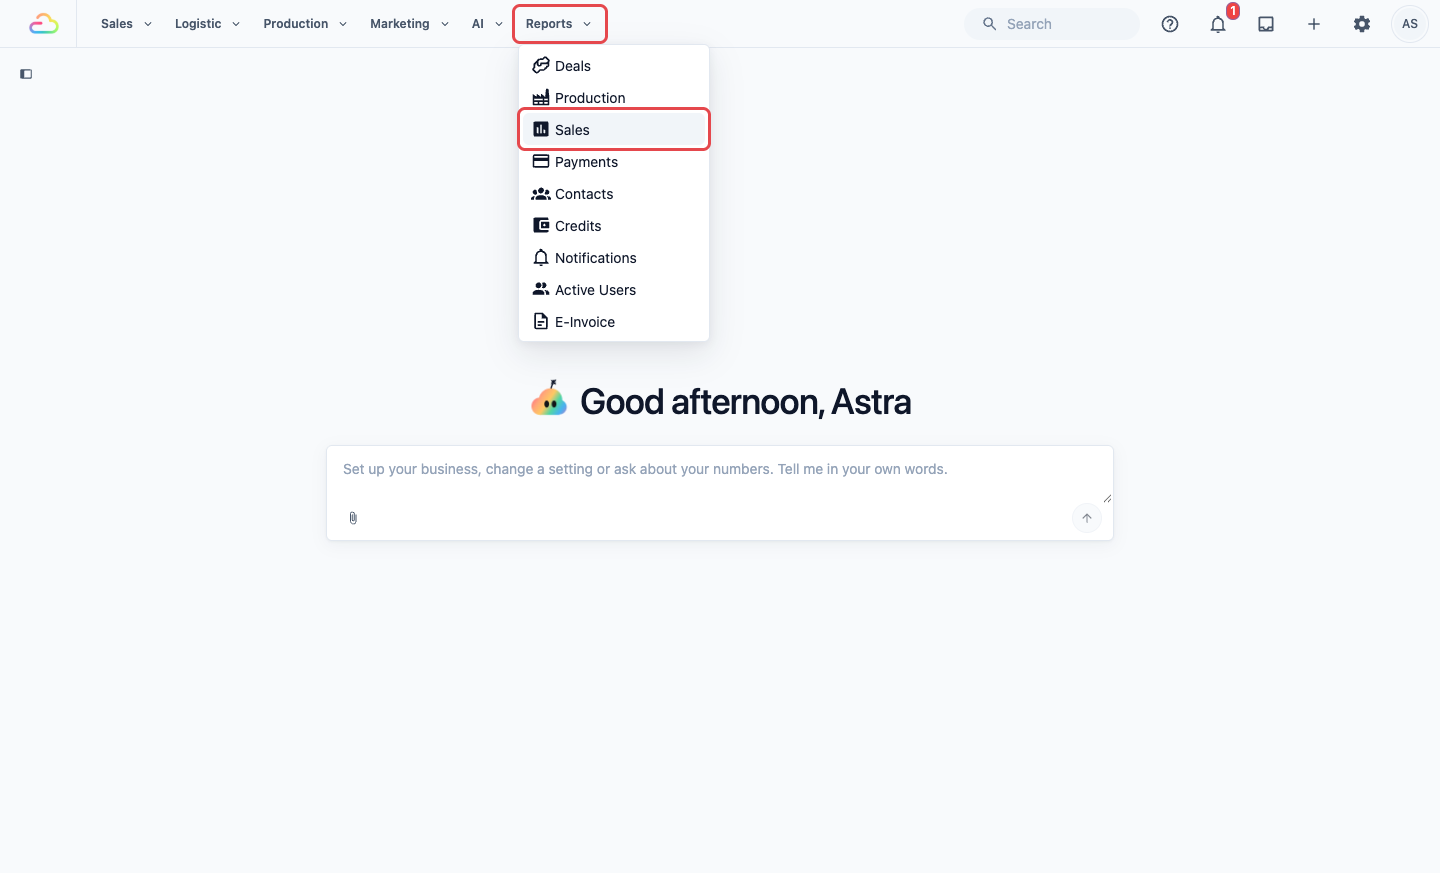
- At the top right, choose how much time to look at: Daily , Monthly , Yearly or Custom .
- Next to it, pick the day, month or year you want. In Custom, pick a start and end date, up to 366 days.
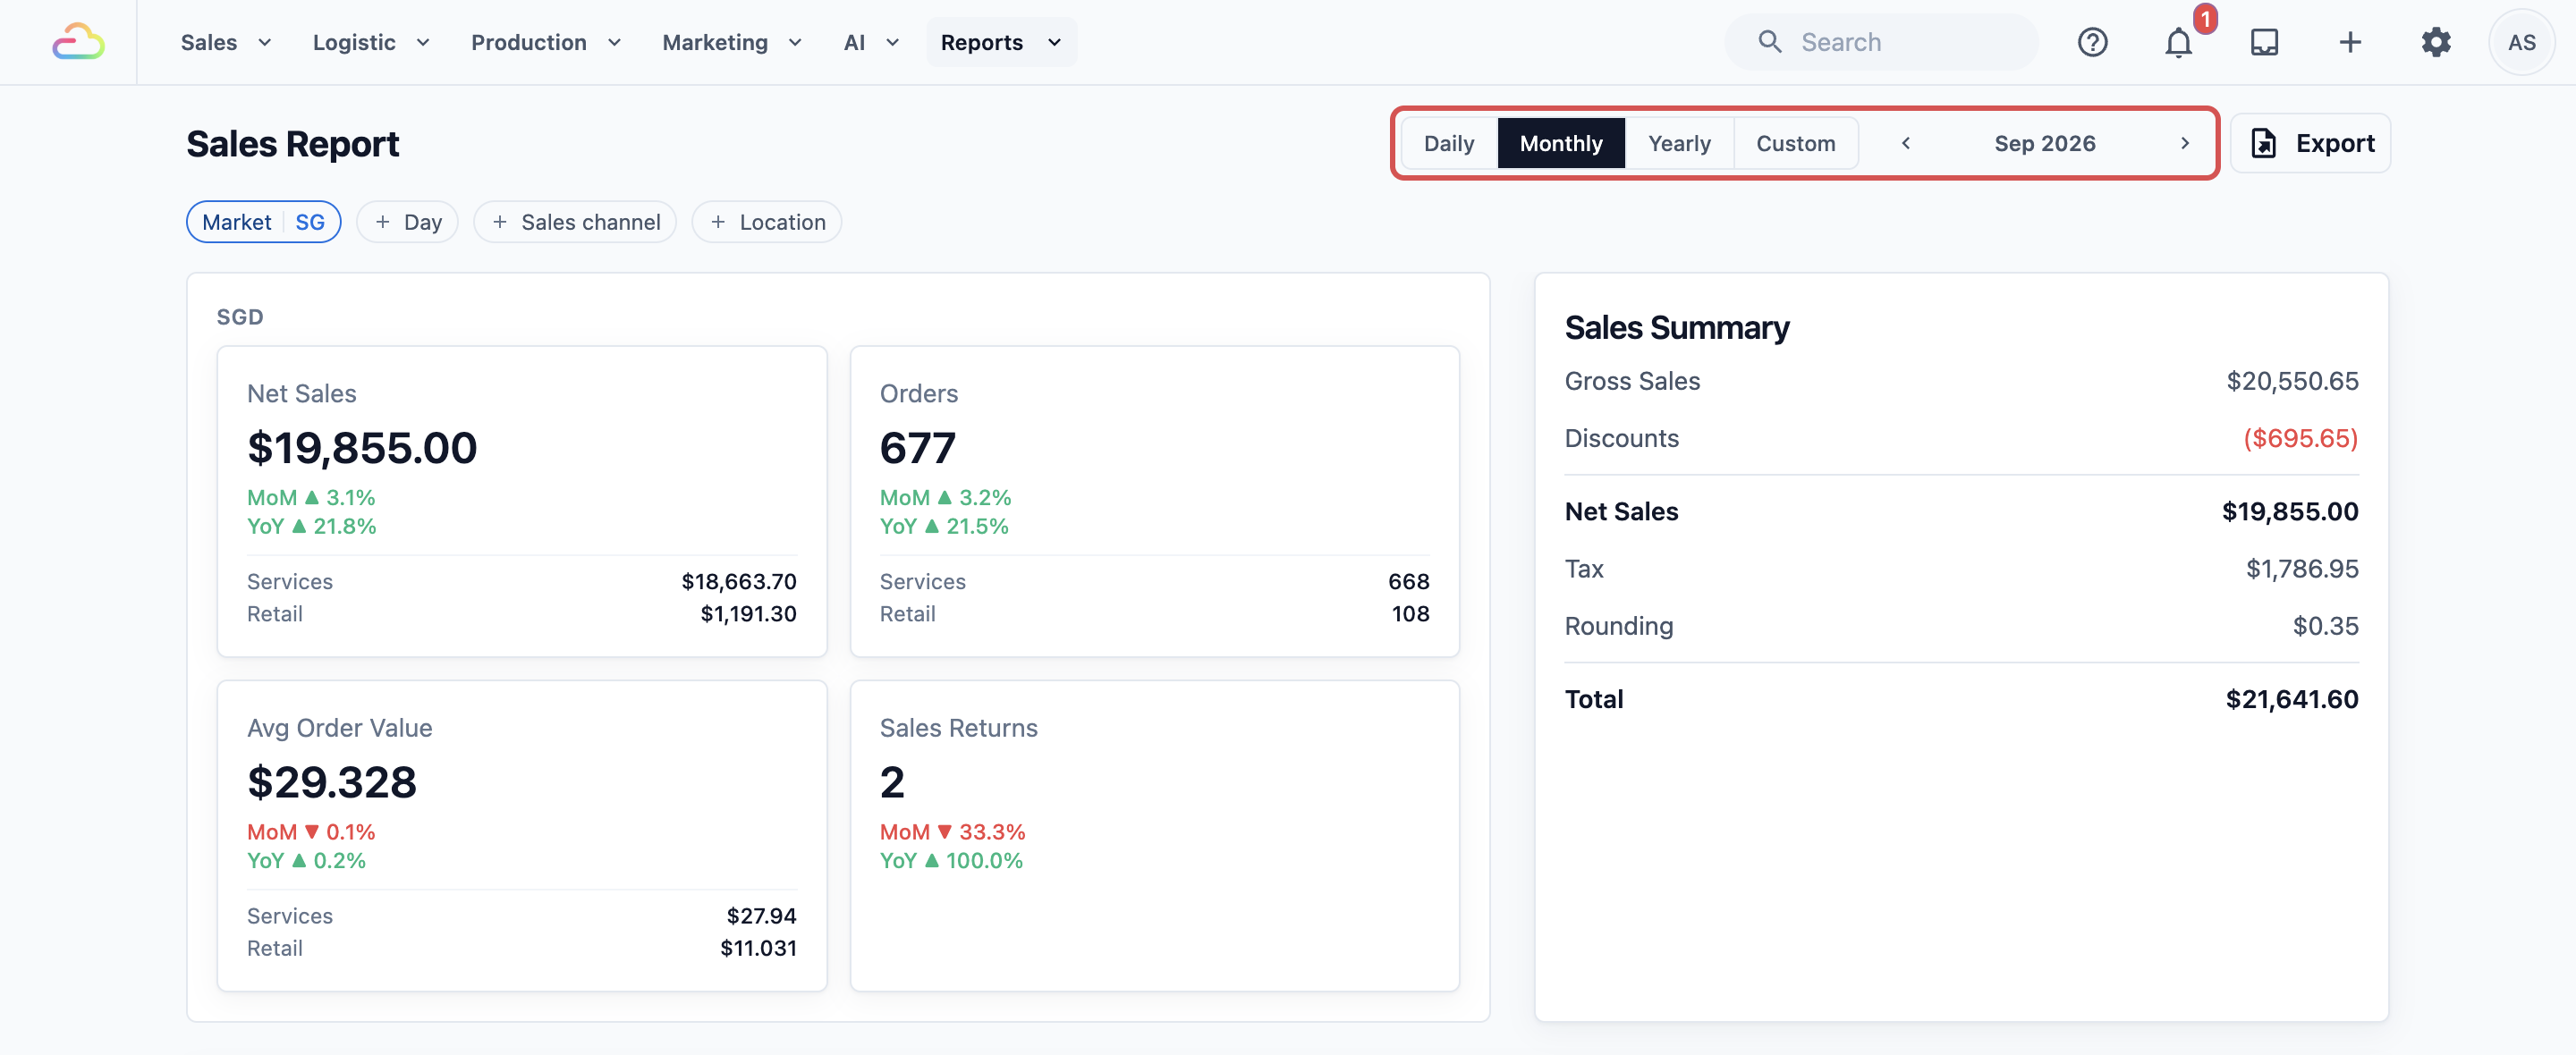
- Below the title, use the filters to narrow the report:
- Market: the country you are looking at, for example Singapore or Malaysia. Each market is shown in its own currency.
- Day: only some days of the week, for example Saturdays. This appears in Monthly and Custom views.
- Sales channel: one place where orders are taken.
- Location: one physical shop.

Read the Summary Cards
The top of the page has two cards.
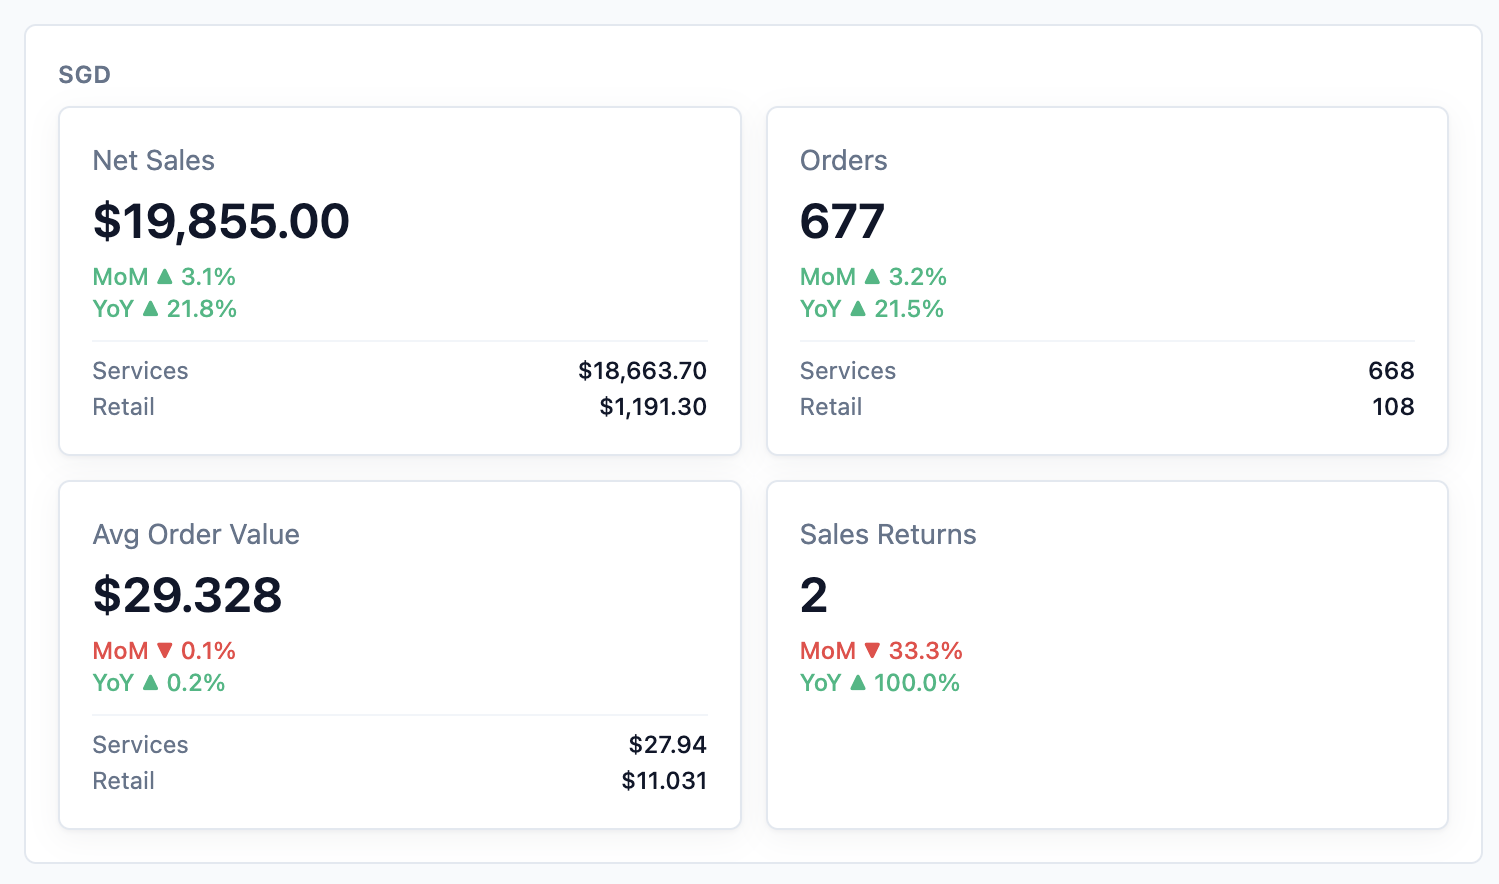
The first card has four boxes:
- Net Sales: your sales after discounts.
- Orders: how many orders were sold.
- Avg Order Value: the average amount of one order.
- Sales Returns: how many returns were made.
Under each number is a small arrow that compares it with an earlier period. Green going up means better. Red going down means lower. The labels tell you what it is compared with:
| Label | Compared with |
|---|---|
| DoD | The day before (Daily view) |
| WoW | The same day last week (Daily view) |
| MoM | The month before (Monthly view) |
| YoY | The same month or year last year |
When you look at the current month, the report compares only the same number of days. So on the 10th, you see 1 to 10 this month against 1 to 10 last month. This keeps the comparison fair.
If your shop sells both services and retail products, each box also shows a Services and a Retail line.
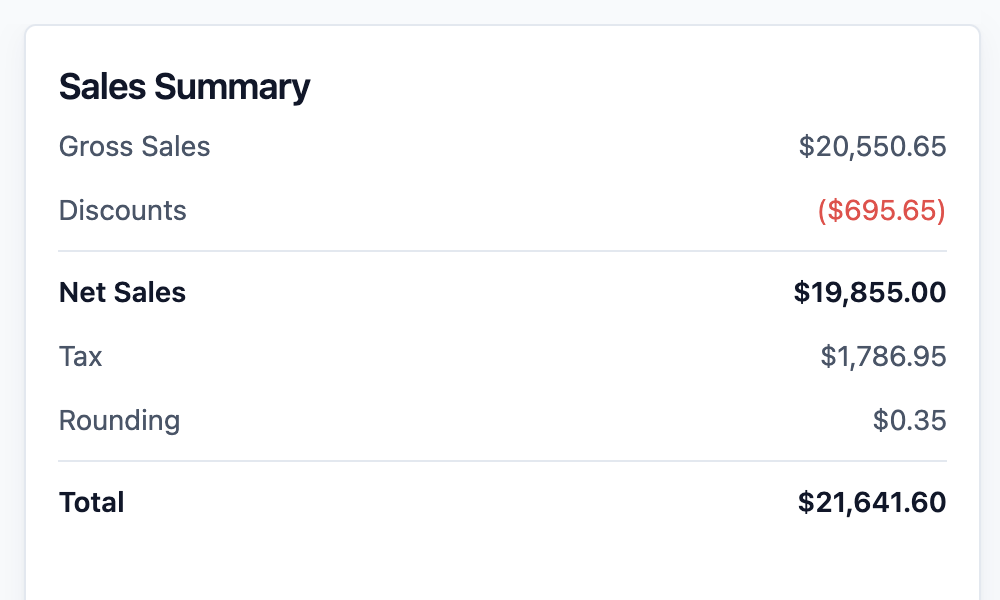
The second card is the Sales Summary. It shows how your sales add up:
- Gross Sales: sales before any discount.
- Discounts: money taken off with discounts and promotions.
- Net Sales: Gross Sales minus Discounts.
- Tax: GST or SST on the sales. It shows only when the period has tax. There's no separate SST or GST report. To get the tax for a period in a file, choose that period and export the report: the file's Summary sheet has a Tax row, and Daily Sales has a Tax column for each day.
- Rounding: small cash rounding adjustments.
- Total: what customers were charged in the end.
Read the Trend Chart
Below the cards is a bar chart.
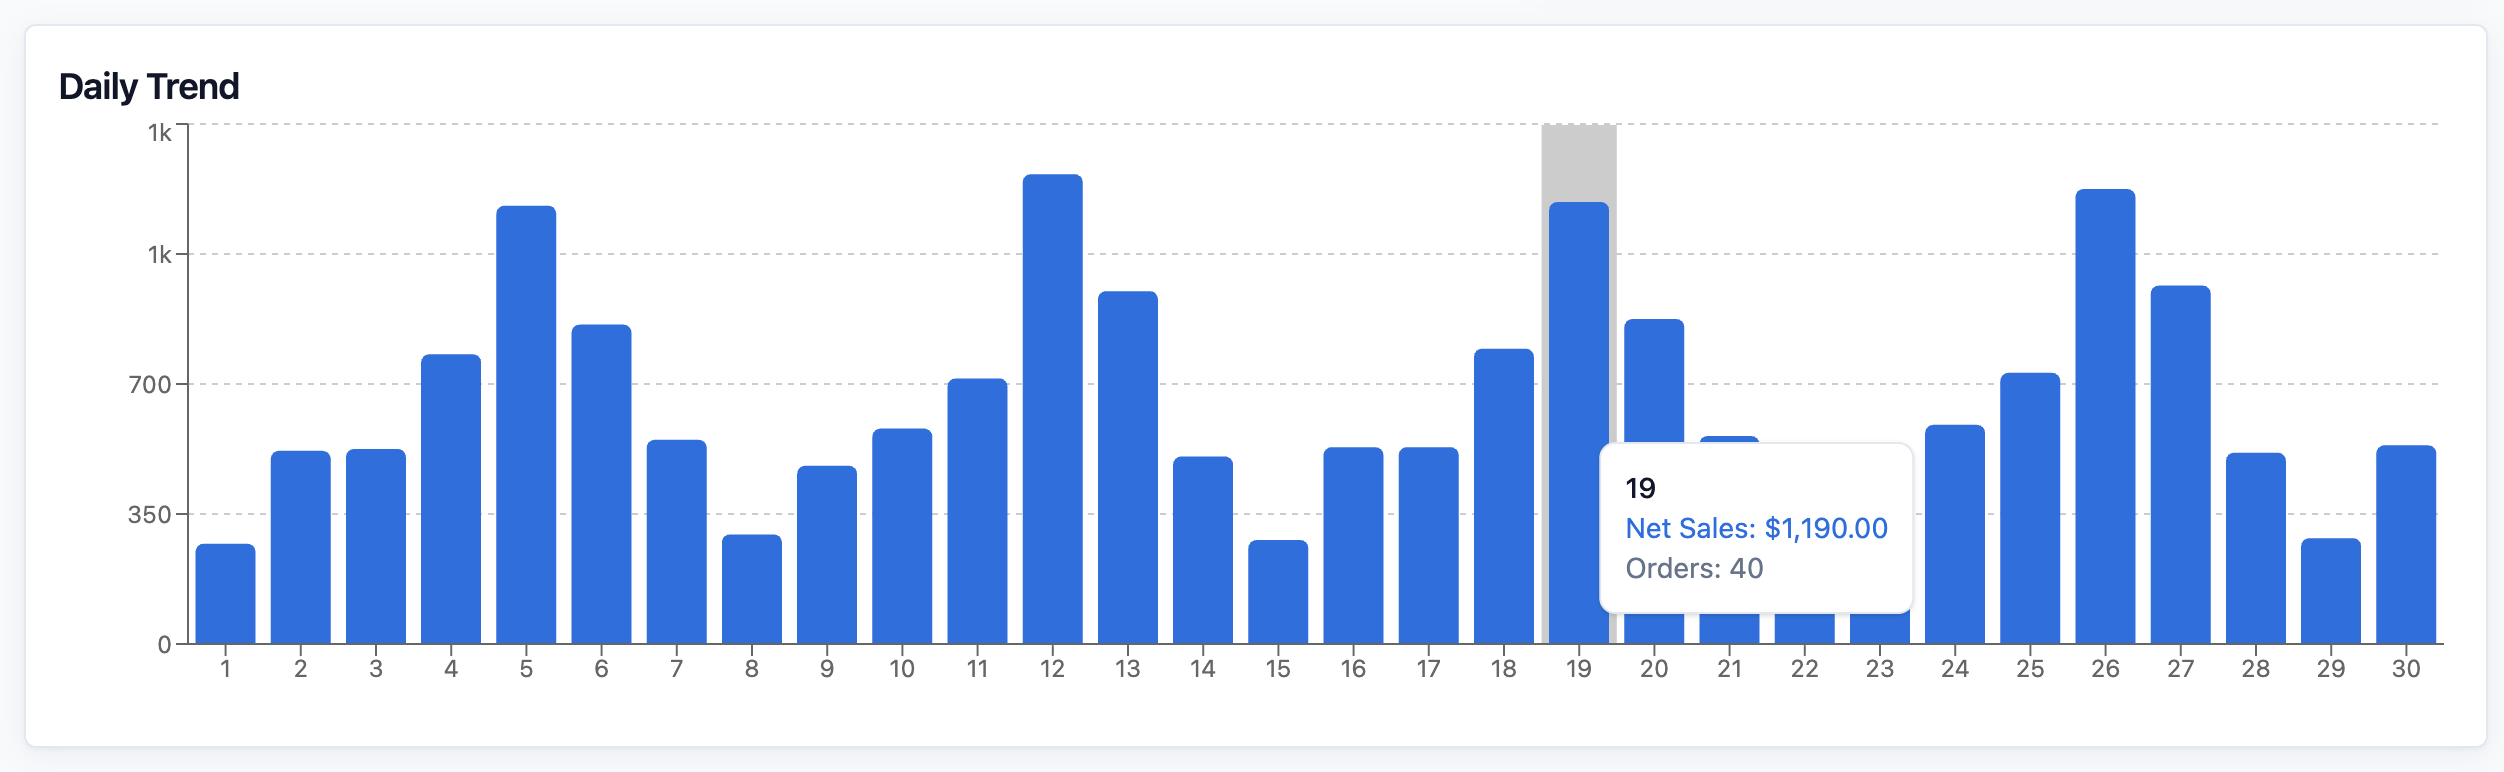
- In Monthly and Custom views, it is called Daily Trend. Each bar is one day.
- In Yearly view, it is called Monthly Trend. Each bar is one month.
- In Daily view, there is no chart, because there is only one day to show.
Taller bars mean more sales. Hover over a bar to see that day's exact amount.
Read the Breakdown Tables
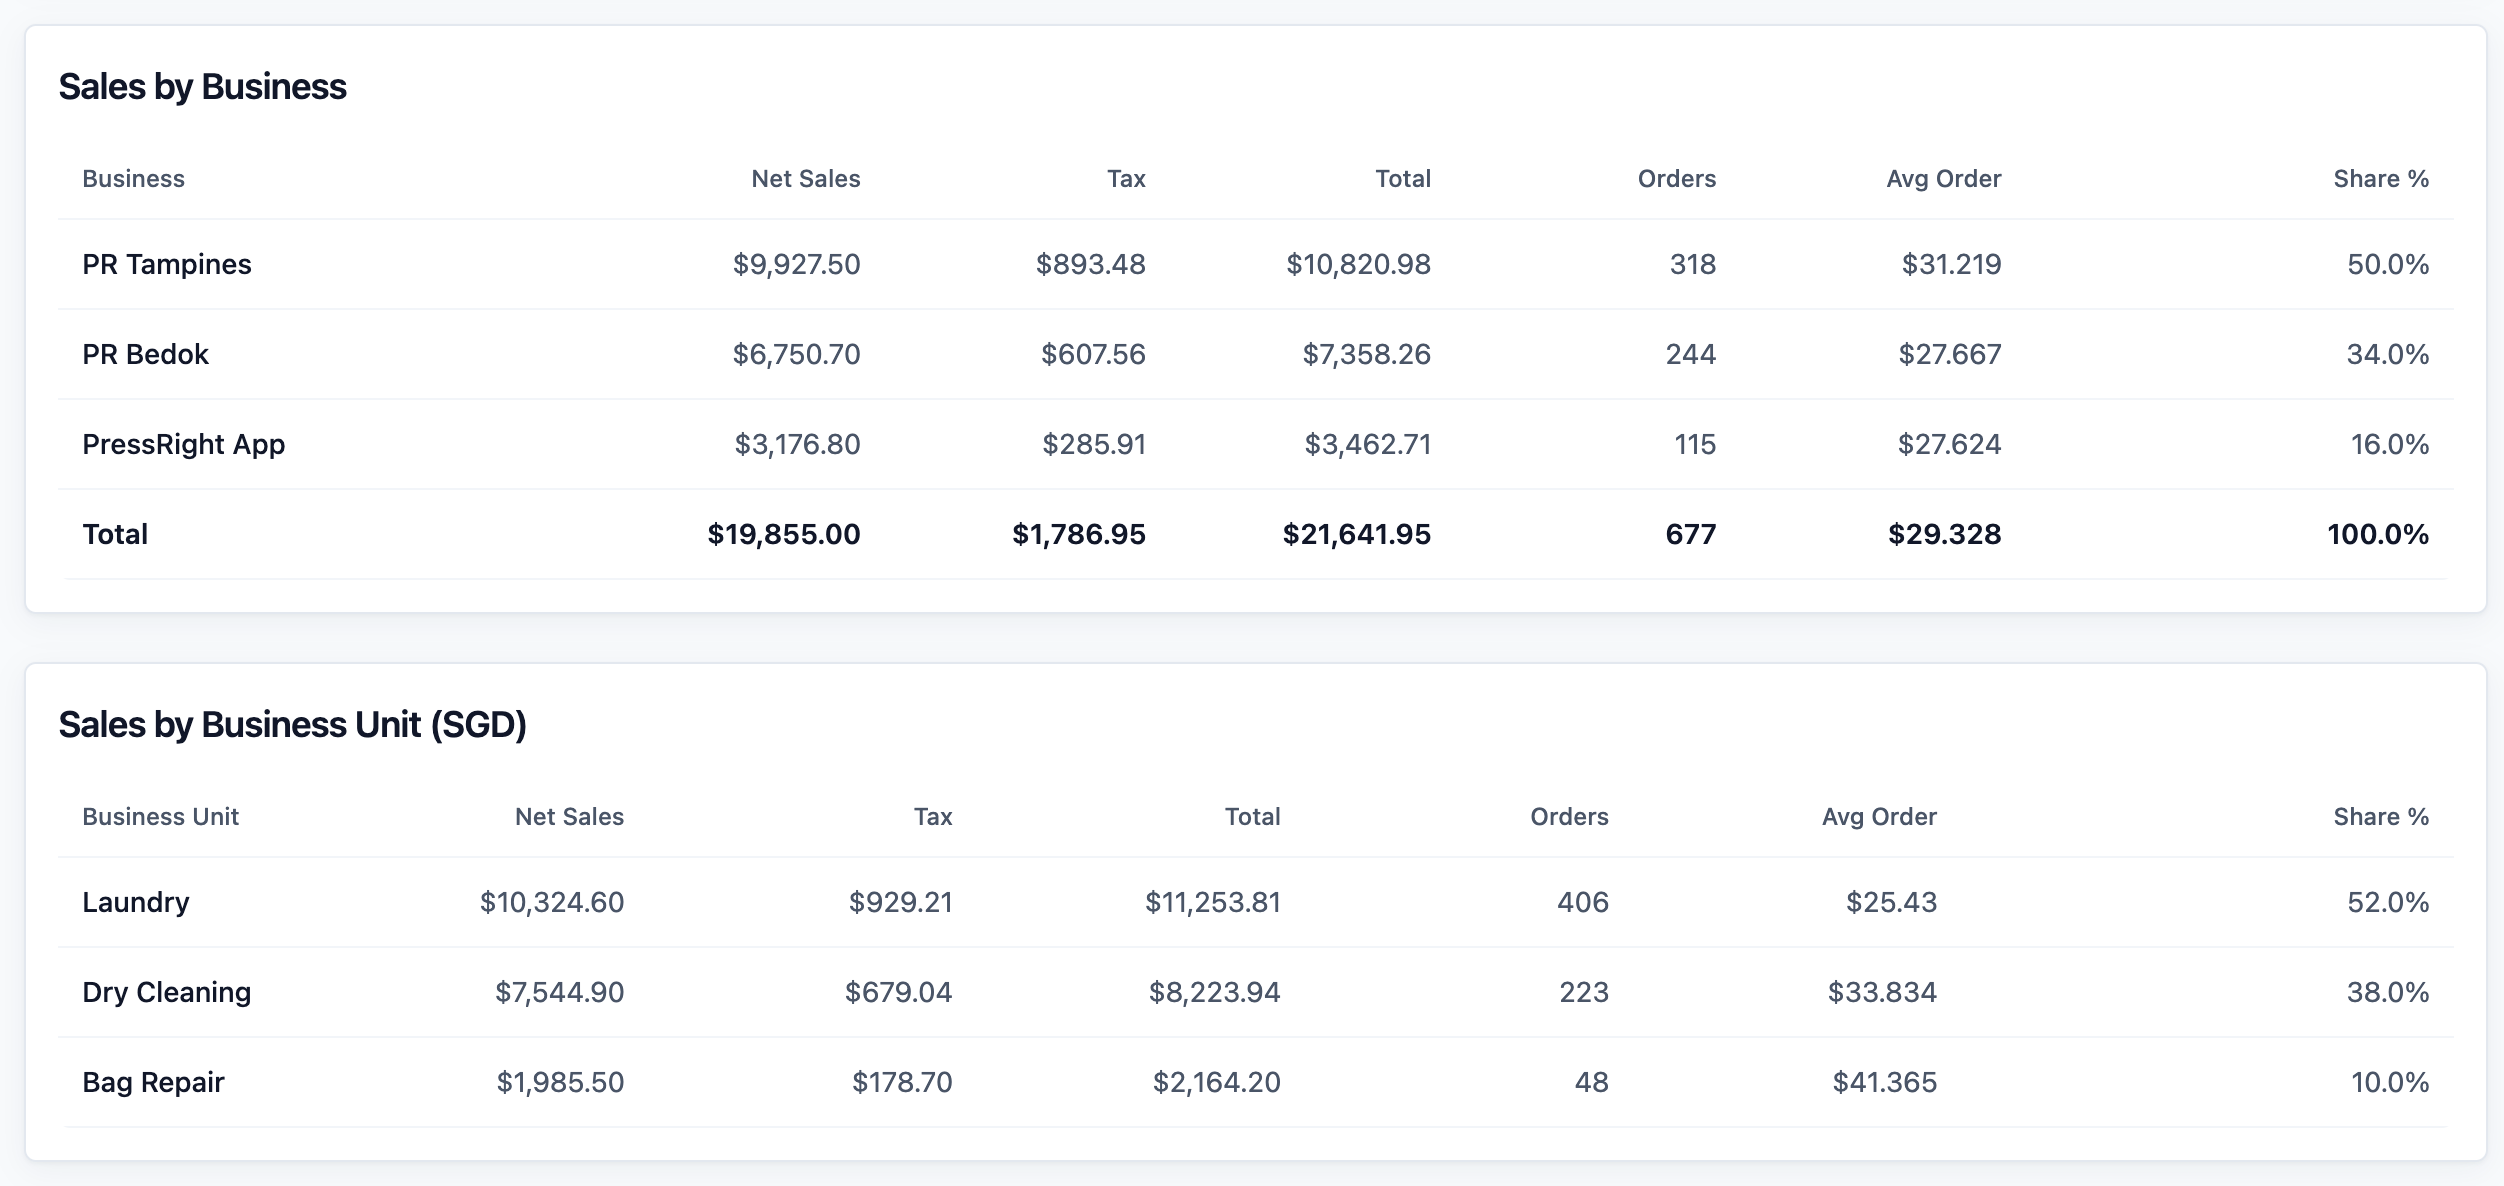
Scroll down to see where your sales came from. Most tables show Net Sales, Orders and a Share % of the total:
- Discount Breakdown: each discount or promotion, how many times it was used and how much it took off. A Refer-a-friend promotion shows two rows: Referral — new customer discount and Referral — referrer rewards. Click a row to see the orders that used it. When you export the report, its Discount Orders sheet lists the same orders with each order's discount and total, so you can see how much a promo code brought in.
- Sales by Business: sales for each sales channel.
- Sales by Company: shown only if you run more than one company.
- Sales by Business Unit: sales for each line of service, for example Laundry or Bag Repair. It shows only if you have more than one. Click a row to see that unit's orders for the same period and filters, for example Orders in Laundry. The newest days show first; click Load more for earlier days. Click an order number to open the order.
- Sales by Lead Source: where the customer came from, for example walk-in or WhatsApp.
- Net Sales by Product: your best-selling items, grouped into Service Items and Retail Products. If you see buttons above the table, such as Product and Service Option, click one to change how the table groups your sales. Any extra sales detail you set up, such as Brand, gets its own button. The table title follows your choice, for example Net Sales by Service Option.
A table with nothing to show is hidden.
Read the Sales Returns Table
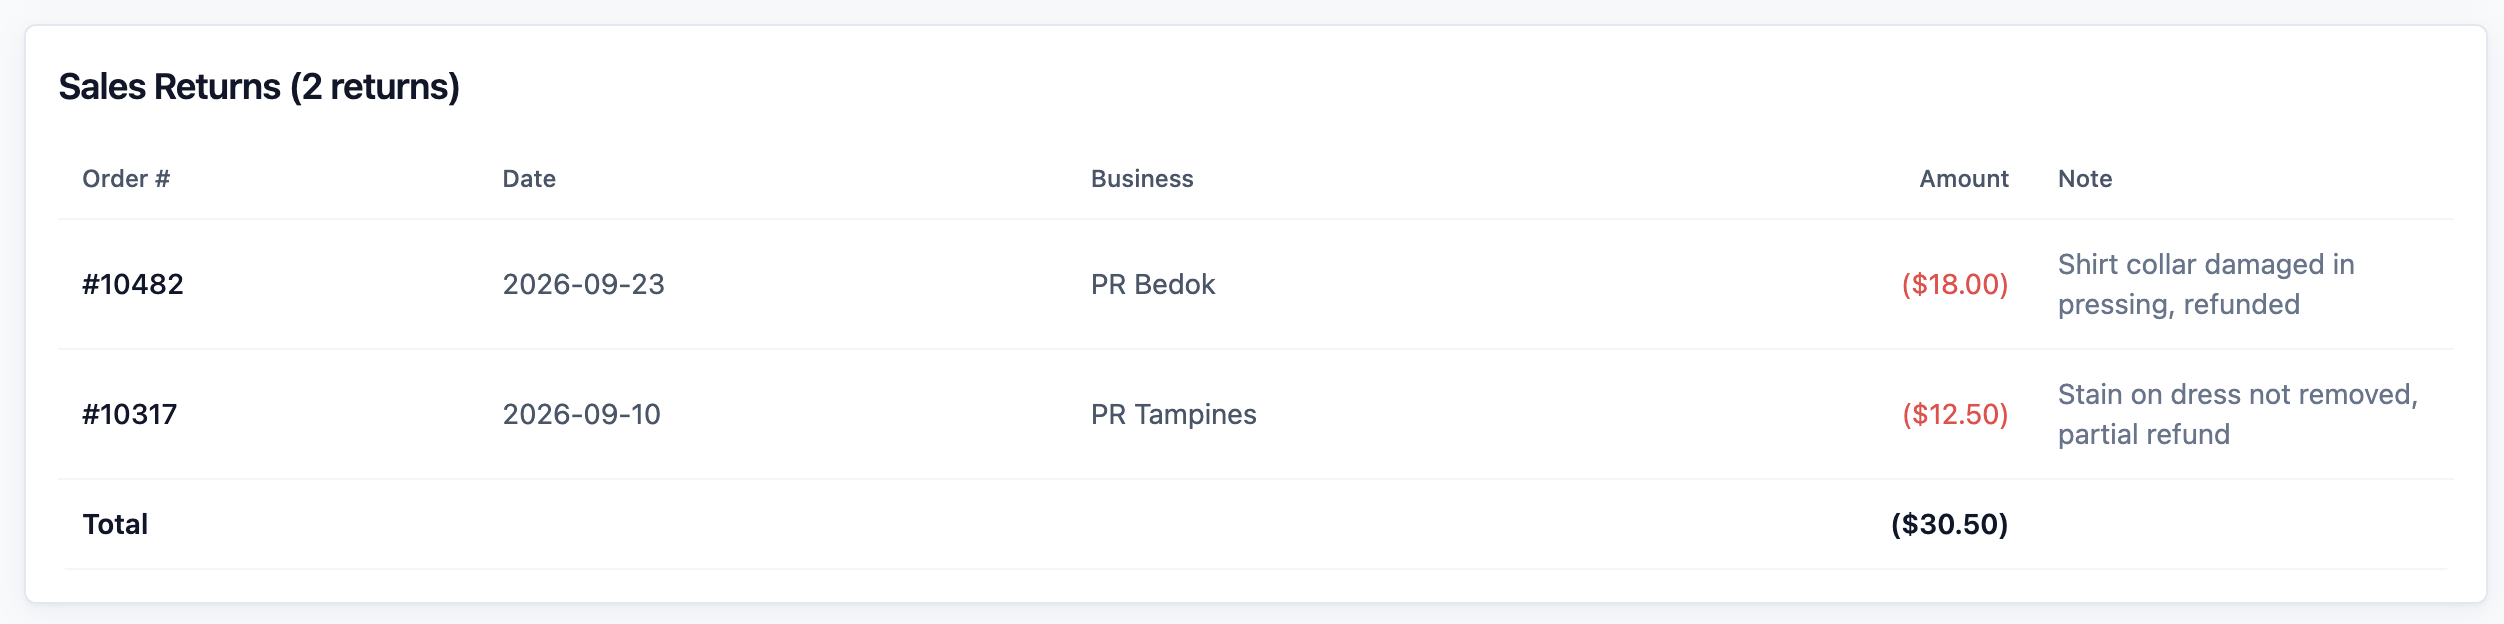
A return is when you give money back or cancel part of an order after it was sold, for example a refund for a damaged shirt. Returns are listed in their own table called Sales Returns, with the number of returns in its title.
It shows the Order #, the Date of the return, the Business (sales channel), the Amount taken off and any Note your staff wrote.
A return is recorded on the day it was made. It does not change the original sale's day. So a return made in June for a May order lowers June's sales, not May's.
Read the Prior-Period Adjustments Table
When a month is closed, a late change to one of its sales is not added to that month. It is recorded in the first open month instead, such as a credit note for a September order issued in October. To learn how closing works, see Closing a Sales Period.
The Prior-period adjustments table lists these late changes, so you can see where they came from:
- In Monthly view, it lists the changes recorded in the month you are looking at.
- In Yearly view, pick a month in Posting month to see that month's changes.
Each row shows the Order #, the Adjustment type (such as Credit note or Void), the Kind (Return, Cancellation or Correction), the Posting date it was recorded on, the Original sale date, the Sales channel and the Amount.
If there are none, the table says No prior-period adjustments.
Check One Day's Orders
To see every order behind one day's number:
- Click Daily .
- Pick the day.
- Scroll to the bottom to the Order Entries table.
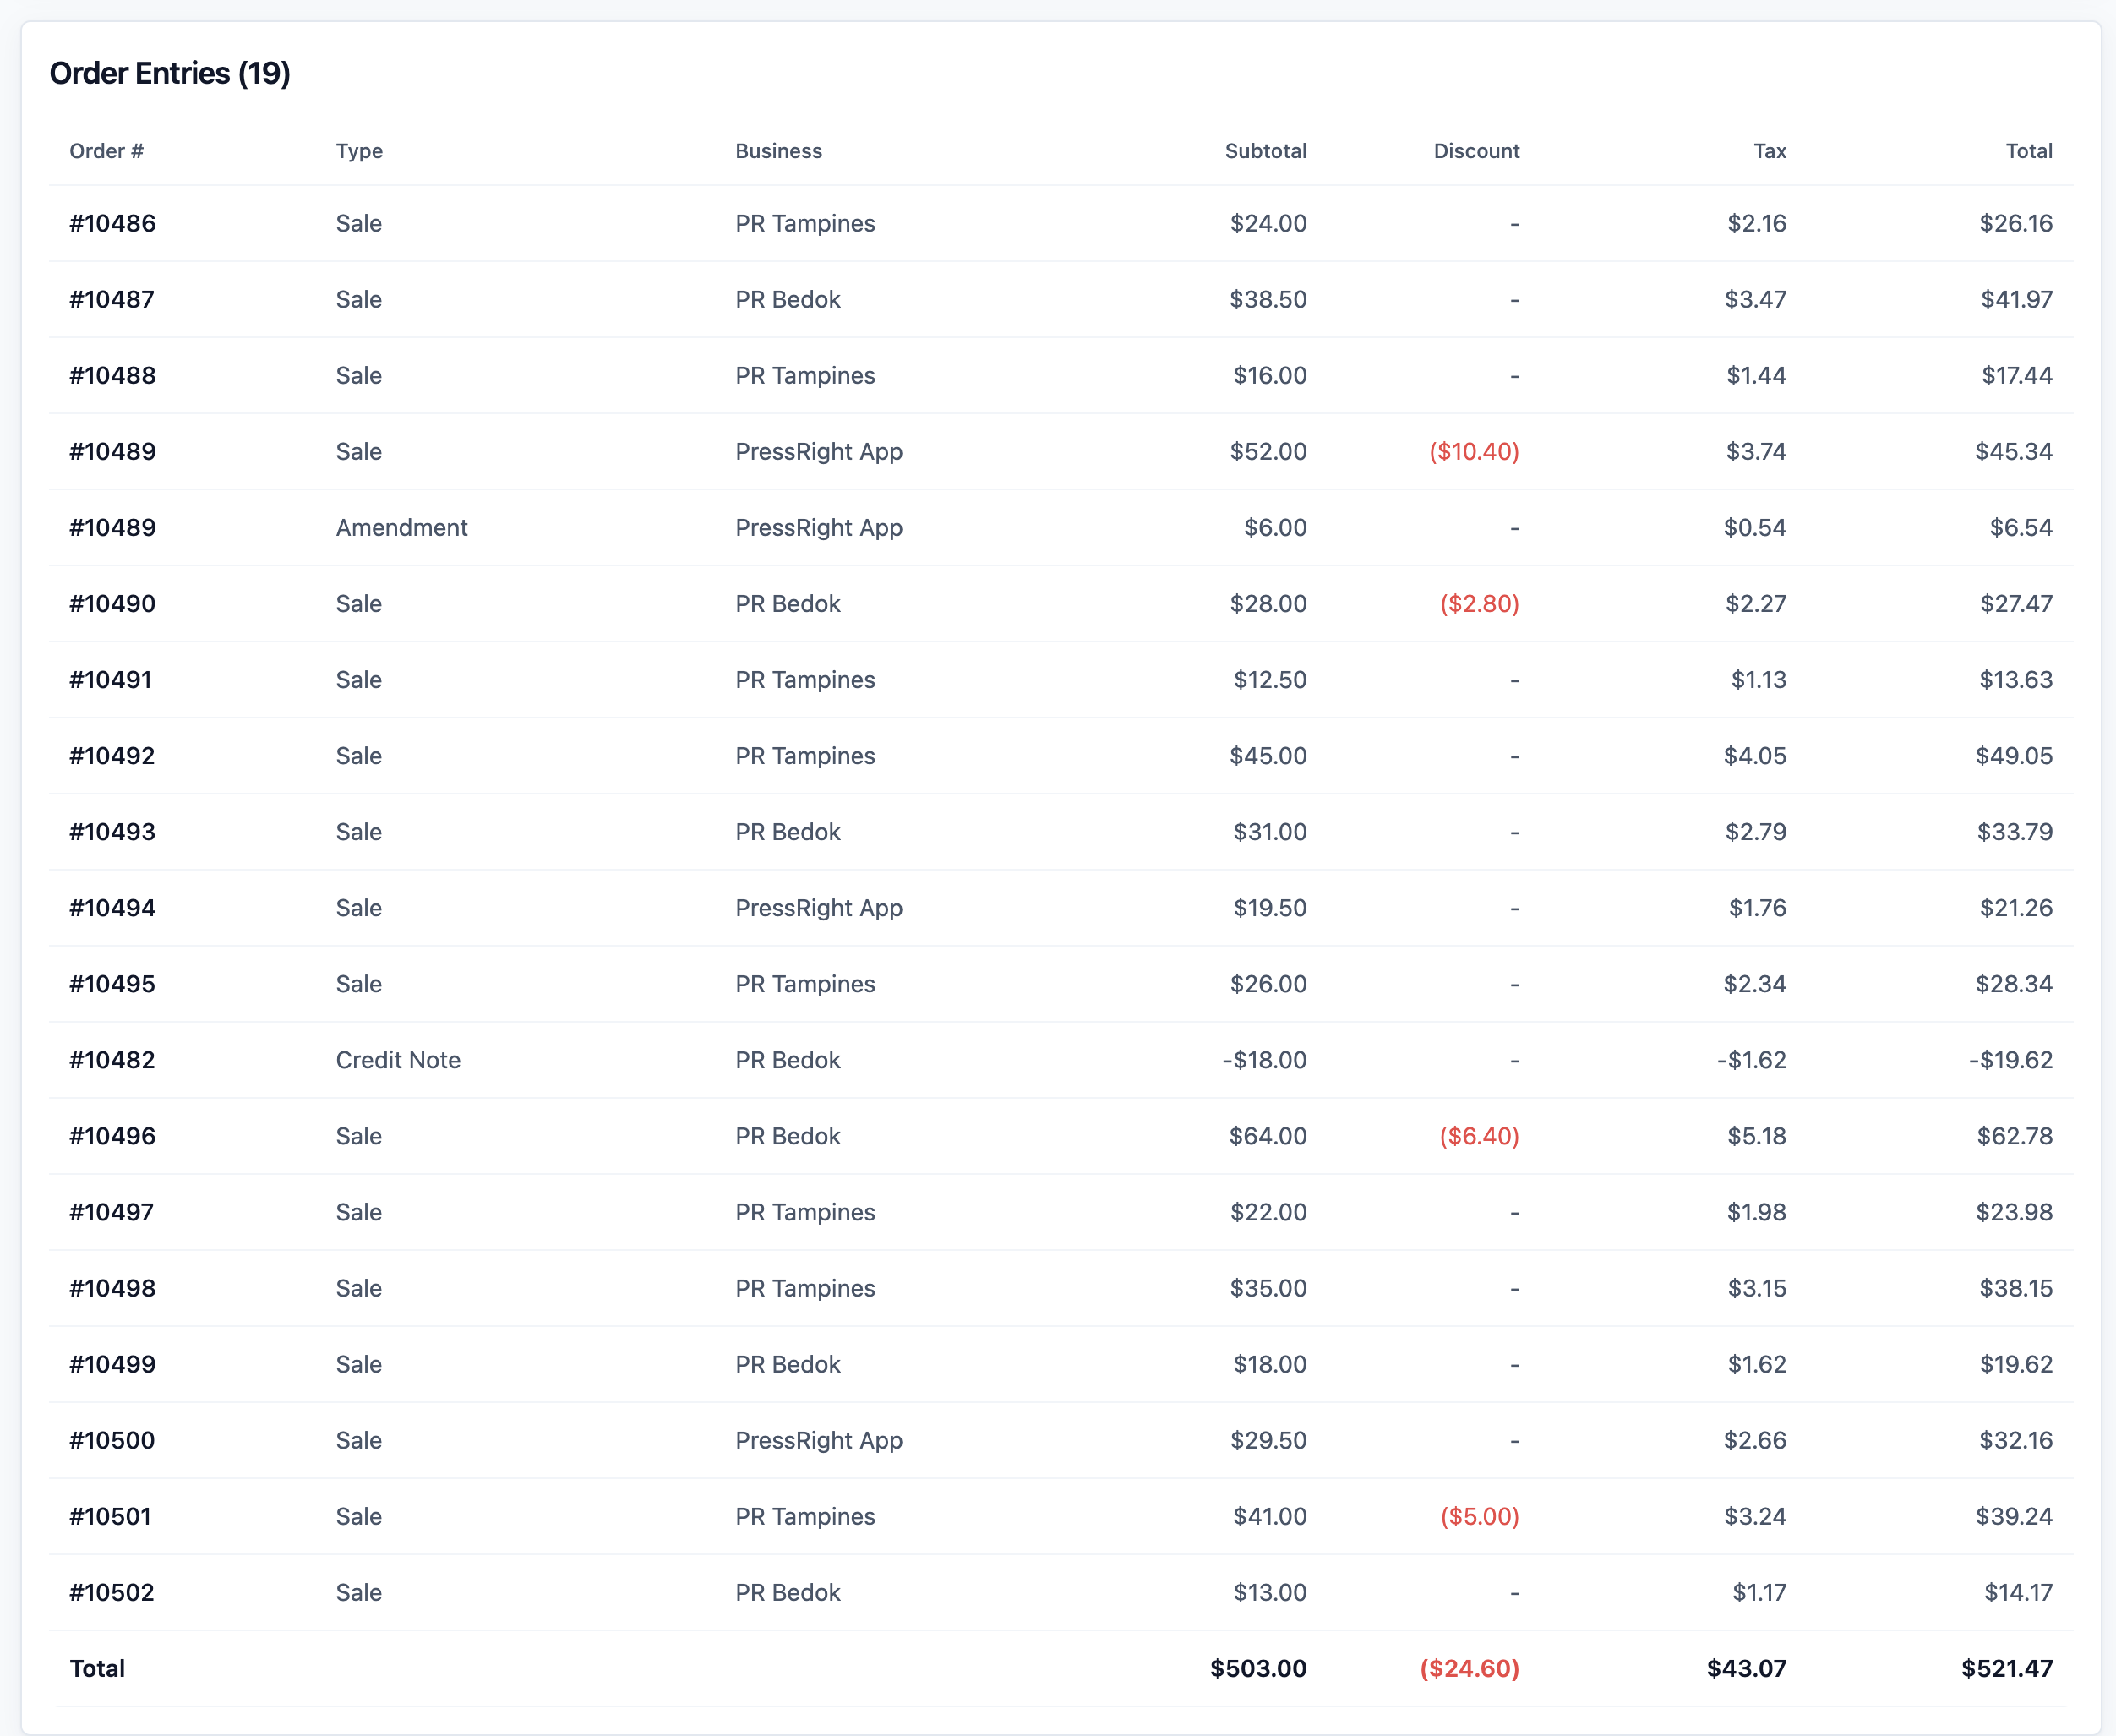
The Type column tells you what each line is:
| Type | What it means |
|---|---|
| Sale | A new order sold |
| Amendment | A change to an order that was already sold, for example an item added |
| Credit Note | A return |
| Void | A cancelled order or a cancelled return |
For a longer period, export the report with Include entry-level details (Entries + Line Items sheets) ticked. The Entries sheet lists every sale, change and return with its order number, business unit and sales channel.
Export This Report
Export the Sales Report when someone needs your figures outside EasyBiz, for example your accountant at month end or your tax filing.
- Set the report to the period and filters you want.
- At the top right, click Export .

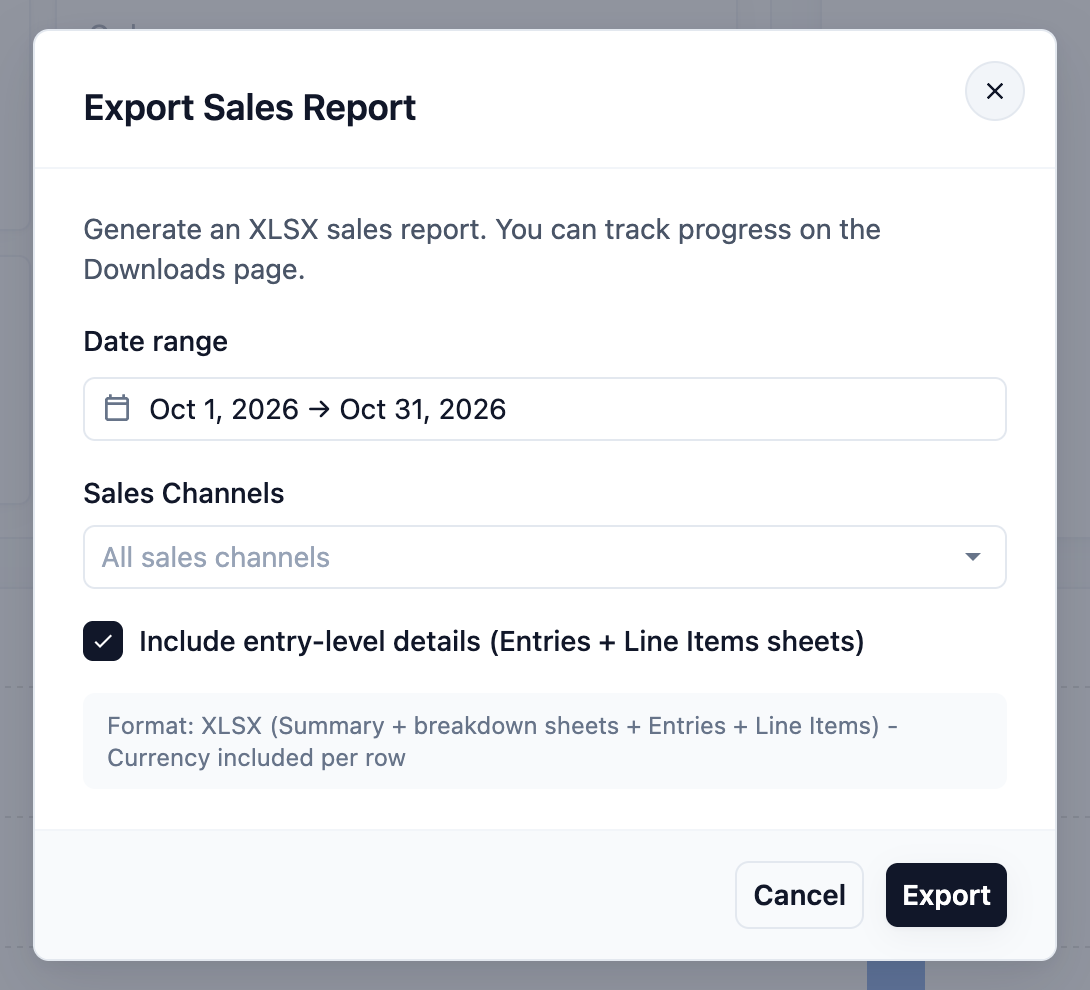
The Export Sales Report window opens.
- Check the Date range. It starts with the period on the page: the day in Daily view, the whole month in Monthly, the whole year in Yearly, or your exact dates in Custom. Change it here if you need different dates.
- Under Sales Channels, keep the sales channel you picked on the page, leave All sales channels, or pick one or more.
- Tick Include entry-level details (Entries + Line Items sheets) if you need every order and every item, not only the totals.
- Read the grey box under the options. It lists the sheets the file will have.
- Click Export .
When Export ready shows under the button, click Download . The file is also kept on your Downloads page. See Exporting to Excel and Downloads.
What carries over from the page
| Filter on the page | In the export |
|---|---|
| Period (Daily, Monthly, Yearly or Custom) | Fills in the Date range. You can change it in the window |
| Sales channel | Fills in Sales Channels. You can change it in the window |
| Market | Used, but not shown in the window. The file covers that market only, in its currency |
| Location | Used, but not shown in the window. The file covers that location only |
| Day (for example, only Saturdays) | Not used. The file covers every day in the date range |
What's in the file
The file has these sheets. A sheet with nothing to show is left out.
| Sheet | What it shows |
|---|---|
| Summary | The currency, the period, and the totals: Gross Sales, Discounts, Net Sales, Orders, Avg Order Value, Tax, Rounding and Total |
| Daily Sales | One row for each day, with its orders, sales, discounts, tax, rounding and total |
| By Sales Channel, By Market, By Location, By Company, By Business Unit | The totals for each one, with their tax, orders, sales returns and share of your sales |
| Product, Service Option and your own sales details, such as Brand | Net sales and quantity for each item or option, with its sales channel, location and business unit |
| By Source, Discount Promotion, Discount Orders | Where your customers came from, each discount or promotion used, and the orders behind each discount with that order's discount and total |
With Include entry-level details (Entries + Line Items sheets) ticked, the file also has an Entries sheet and a Line Items sheet. Entries lists every sale, change and return with its order number, business unit, sales channel and tax. Line Items lists every item on those orders with its quantity and amount.
You can export up to one year (366 days) at a time. With the tick box on, the limit is 92 days. The window shows a red message when your dates are too long.
Example: PressRight Finds Its Busiest Day
PressRight Laundry has two staff at the counter every day. The owner wants to know if that makes sense.
- She opens Reports , then Sales , and clicks Monthly for last month.
- In the Daily Trend chart, the Saturday bars are clearly the tallest. Tuesday bars are the shortest.
- In the Day filter, she picks Sat. The summary cards now show only Saturdays: S$4,860 Net Sales from 162 orders.
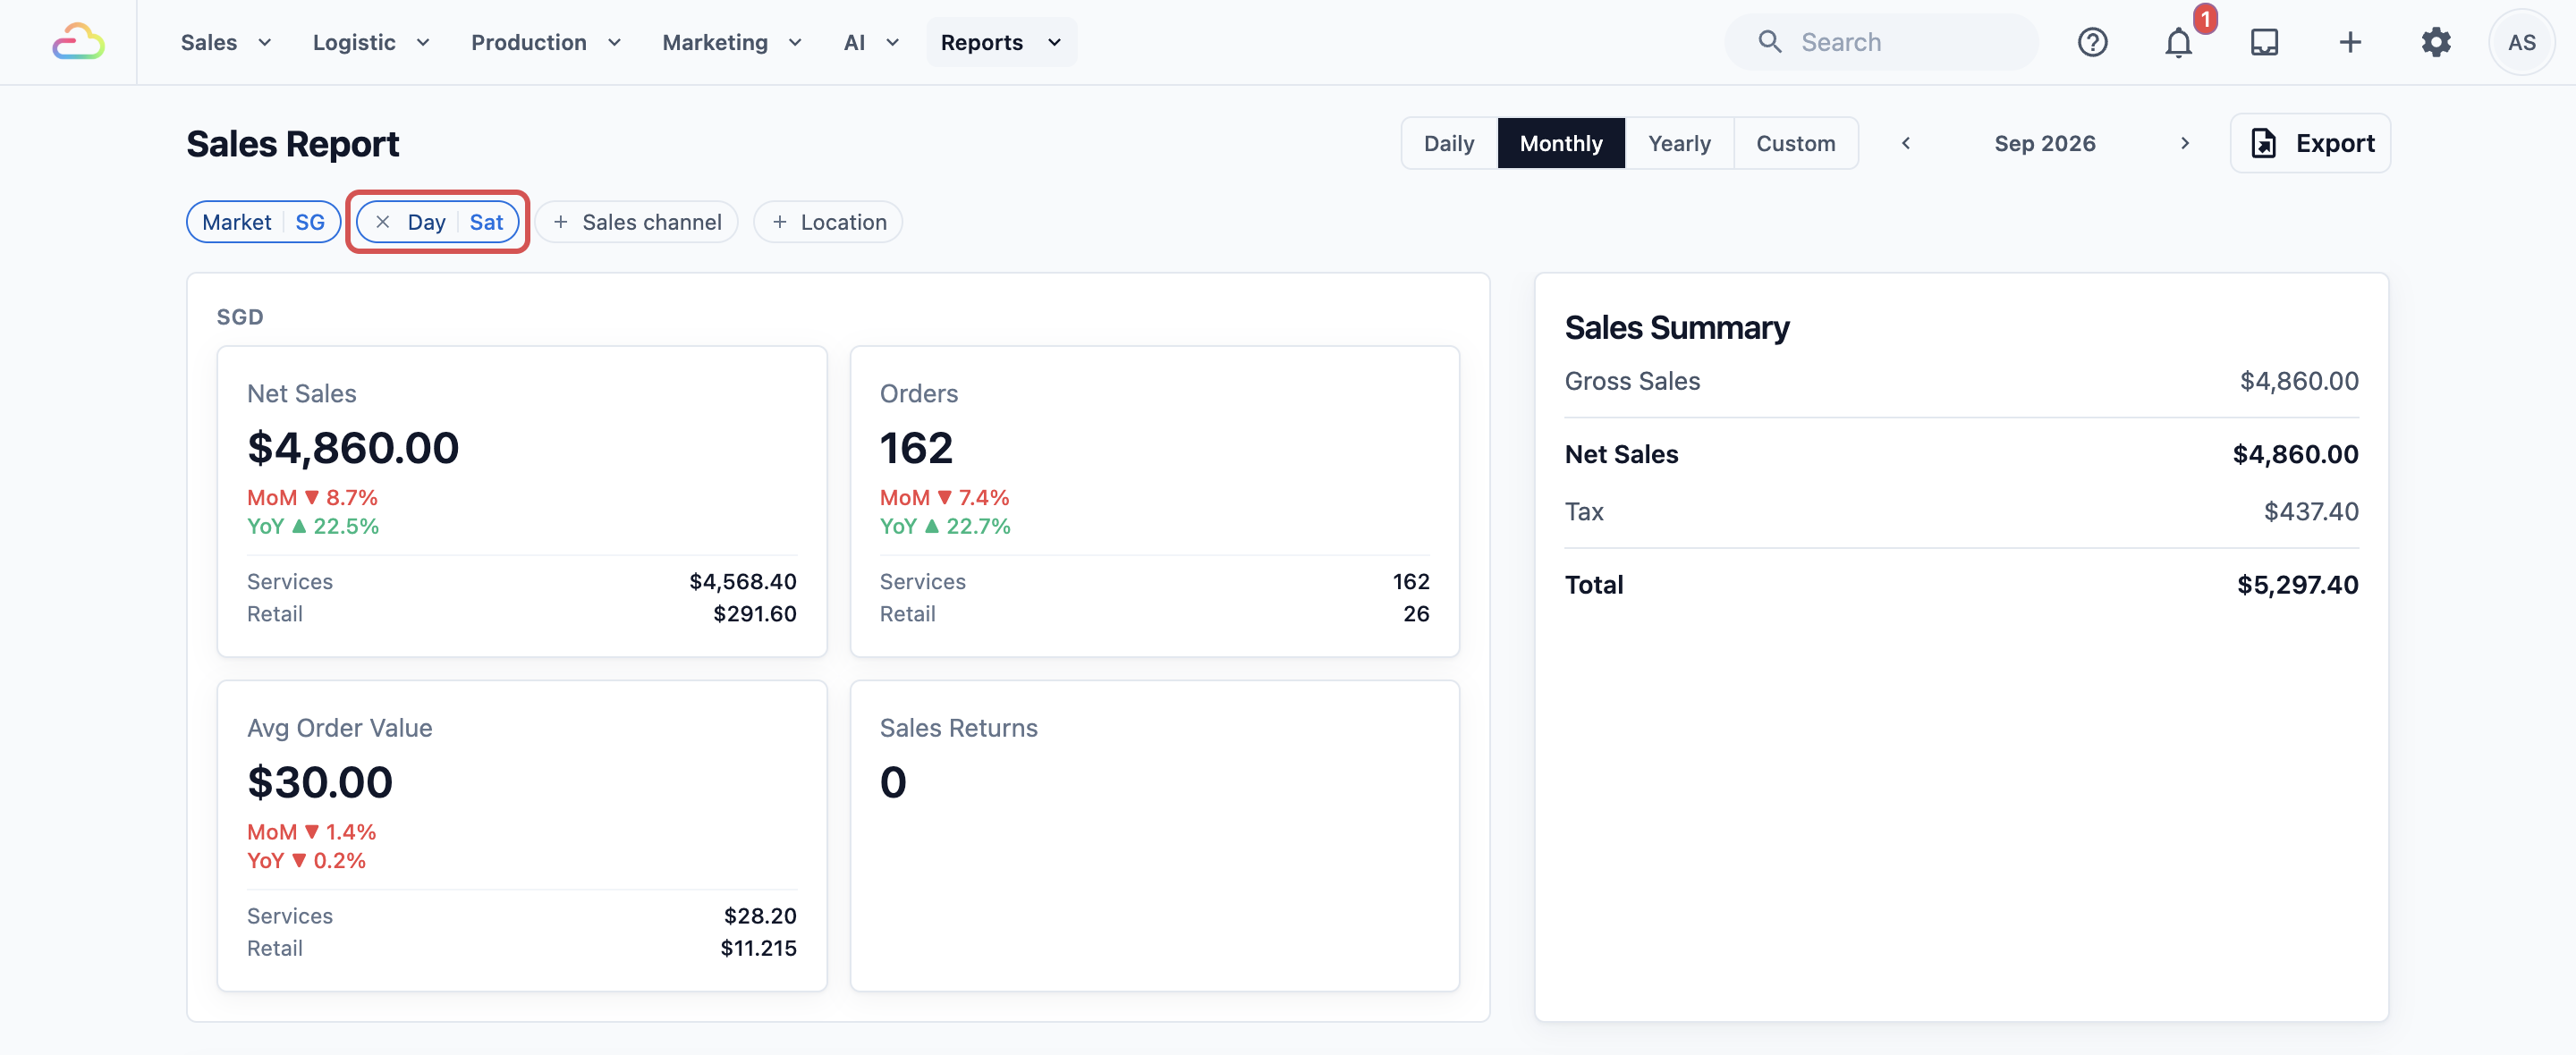
- She changes the Day filter to Tue. Tuesdays show S$1,420 from 51 orders.
PressRight now knows Saturdays bring in more than three times Tuesday's sales. The owner adds a third staff member on Saturdays and moves one staff member to ironing on Tuesdays.
FAQs
Does a sale count when the order is created or confirmed?
When the price is confirmed. An order with a final price counts as soon as it is confirmed. An order created with the price "to be confirmed" (for example, a bag repair waiting for a quote) only counts once the price is set, and it counts on that day. Payment has nothing to do with it. Unpaid orders still count.
Why does an order appear on a different date than expected?
There are three common reasons. The price was confirmed on a later day than the order was taken. The sales period for that day was already closed, so the sale was moved to the next open day. Or it is a return, which counts on the day of the return. Changes moved out of a closed month are listed in the Prior-period adjustments table, with their original sale date. See Closing a Sales Period.
Are B2B (agent) orders included?
Yes. Orders from agents, meaning business customers who order through their own agent account, are included. Unlike shop orders, they always count on the order date, even if the price is confirmed later. This keeps them in line with the agent's monthly bill.
Why doesn't Net Sales match the cash in my Payments Report?
Sales counts work sold, and payments count money received. A customer who pays a deposit today and the rest next week shows up in different places in each report. See Sales vs Payment Totals.
Some of my orders are missing from the report. Why?
Sales channels marked as test channels are left out of the Sales Report. Also check the Market, Sales channel and Location filters. Each market is shown separately in its own currency.
I see a yellow message about unresolved entries. What does it mean?
Some sales could not yet be placed in a market or currency, so they are not in the totals. Contact support with the date shown in the message, and they can fix it.
What's Next
You can now read your sales by day, month and year, and find your busiest days. Next, learn why your sales and payment totals are different, and which one to trust for what, in Sales vs Payment Totals.