## Before You Start
Make sure you have:
- Access to the Deals Report. If **Deals** is missing from your **Reports** menu, your account does not have it yet. See [Report Access for Staff](/docs/report-access-for-staff).
- A basic feel for choosing a period and filters. See [Report Periods and Filters](/docs/report-periods-and-filters).
- Customers messaging your shop on WhatsApp, so the report has deals to count.
---
## What the Deals Report Is
A deal is one customer enquiry that could turn into business. When a new customer messages your shop on WhatsApp, EasyBiz opens a deal for that chat. The deal then moves through your stages, for example **New Enquiry**, then **Quoted**, then **Won** or **Lost**.
The Deals Report is your enquiry scoreboard. It counts the enquiries that came in during a period, how many turned into orders, how many you lost and how fast your staff replied.
The Deals Report helps you decide things like:
- Which advert or campaign brings enquiries that actually become orders.
- Which staff member is best at turning a quote into a sale.
- Which enquiries still need a follow-up before they go cold.
Without it, you only see enquiries one chat at a time. You can spend money on an advert that brings plenty of messages but almost no orders, and never notice.
---
## Open the Deals Report
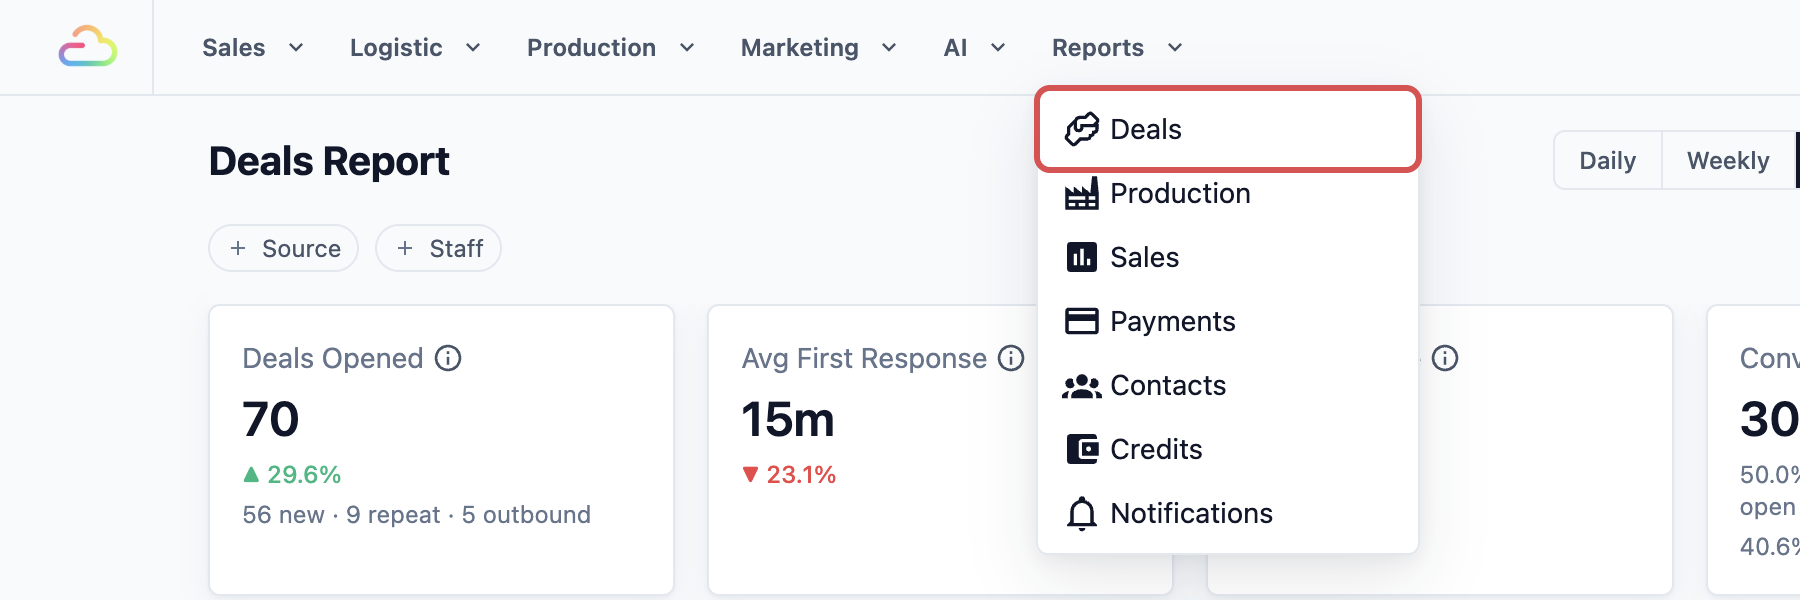
1. In the top menu, click Reports .
2. Click Deals .
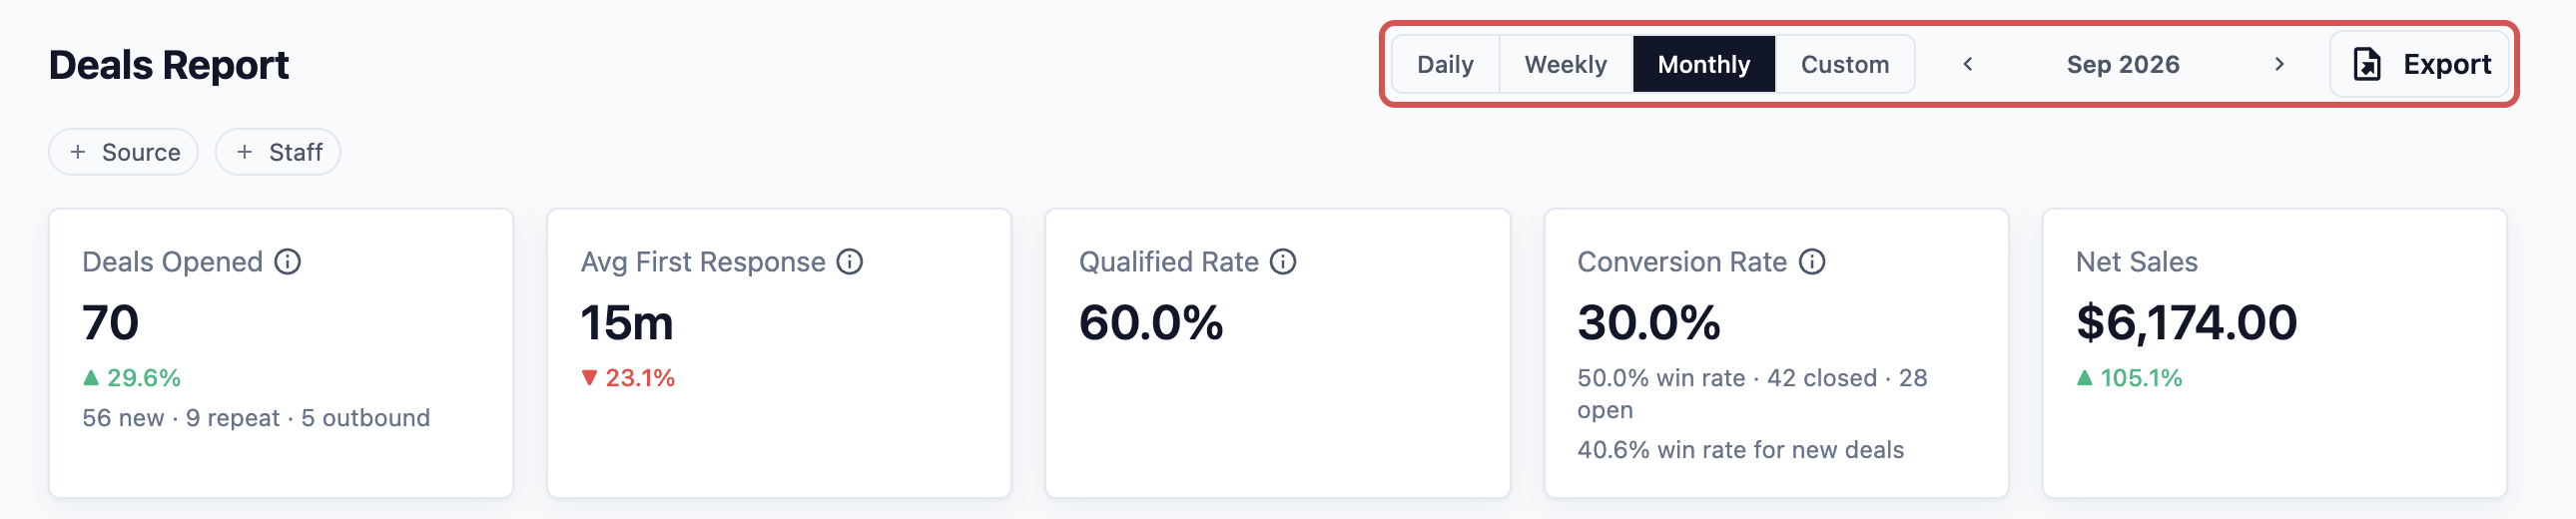
3. At the top right, choose how much time to look at: Daily , Weekly , Monthly or Custom . A custom range can cover up to 90 days.
4. Next to it, pick the day, week, month or dates you want.
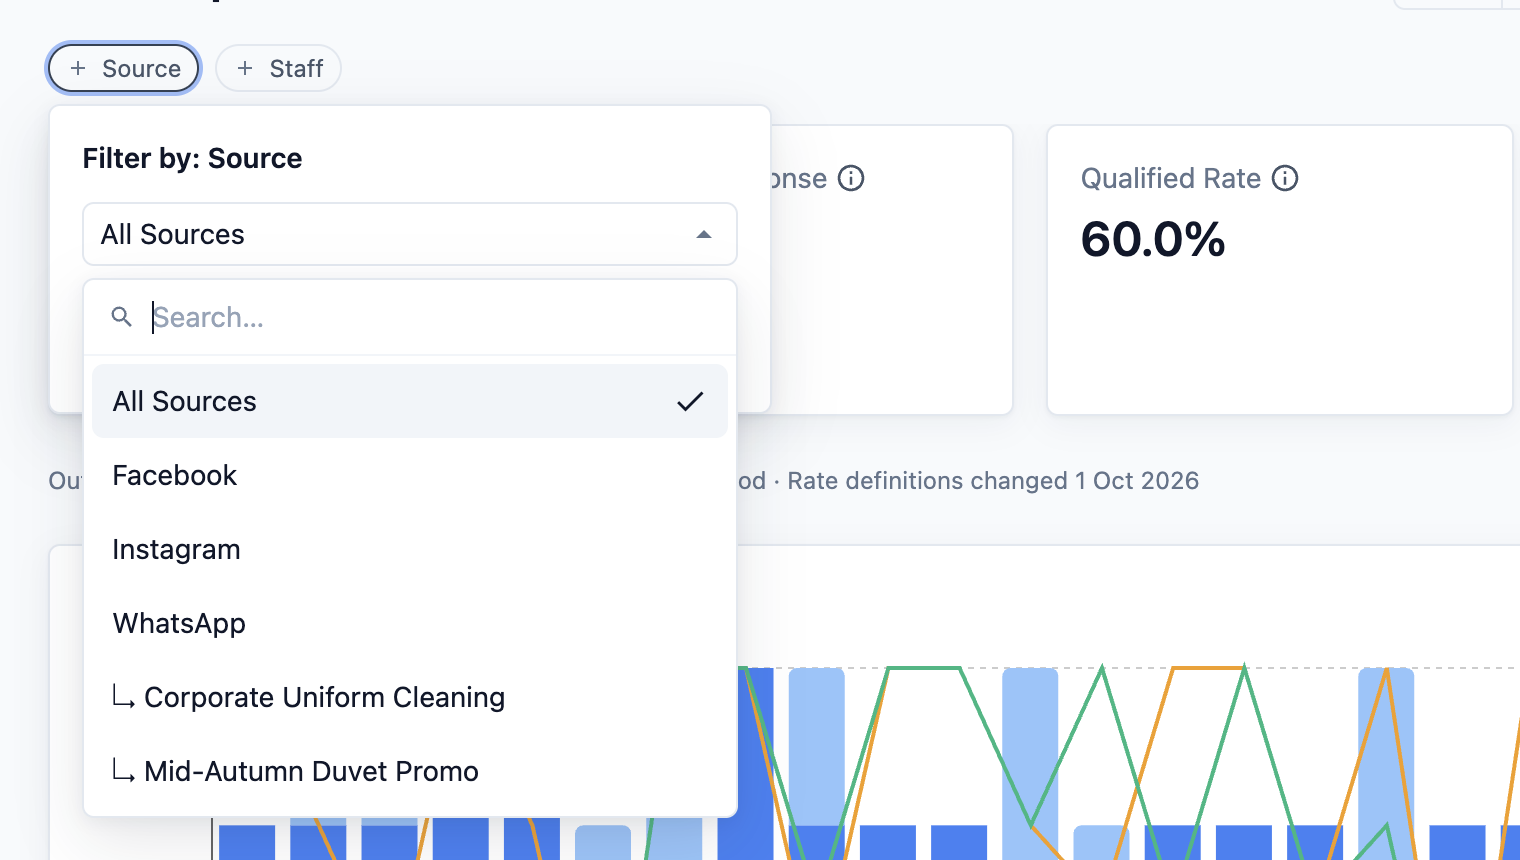
5. Below the title, use the filters to narrow the report:
- **Source**: where the enquiry came from, for example WhatsApp, Facebook or a campaign.
- **Staff**: the staff member who owns the deal.
You can use one filter at a time. Picking a staff member clears the source, and picking a source clears the staff member.
To take the deals into Excel, see [Export This Report](#export-this-report).
---
## Read the Summary Cards
The top of the page has five cards:
- **Deals Opened**: how many enquiries came in during the period. Underneath, you may see a split such as "28 new · 9 repeat · 3 outbound". New means a first-time customer messaged you. Repeat means they had ordered before. Outbound means your shop sent the first message.
- **Avg First Response**: how long, on average, a customer waited for the first reply from your staff. Only working hours count, and automatic replies are left out.
- **Qualified Rate**: the share of deals that got past the first enquiry, for example to a quote.
- **Conversion Rate**: the share of all deals opened that were won.
- **Net Sales**: the money from the orders behind your won deals, after discounts.
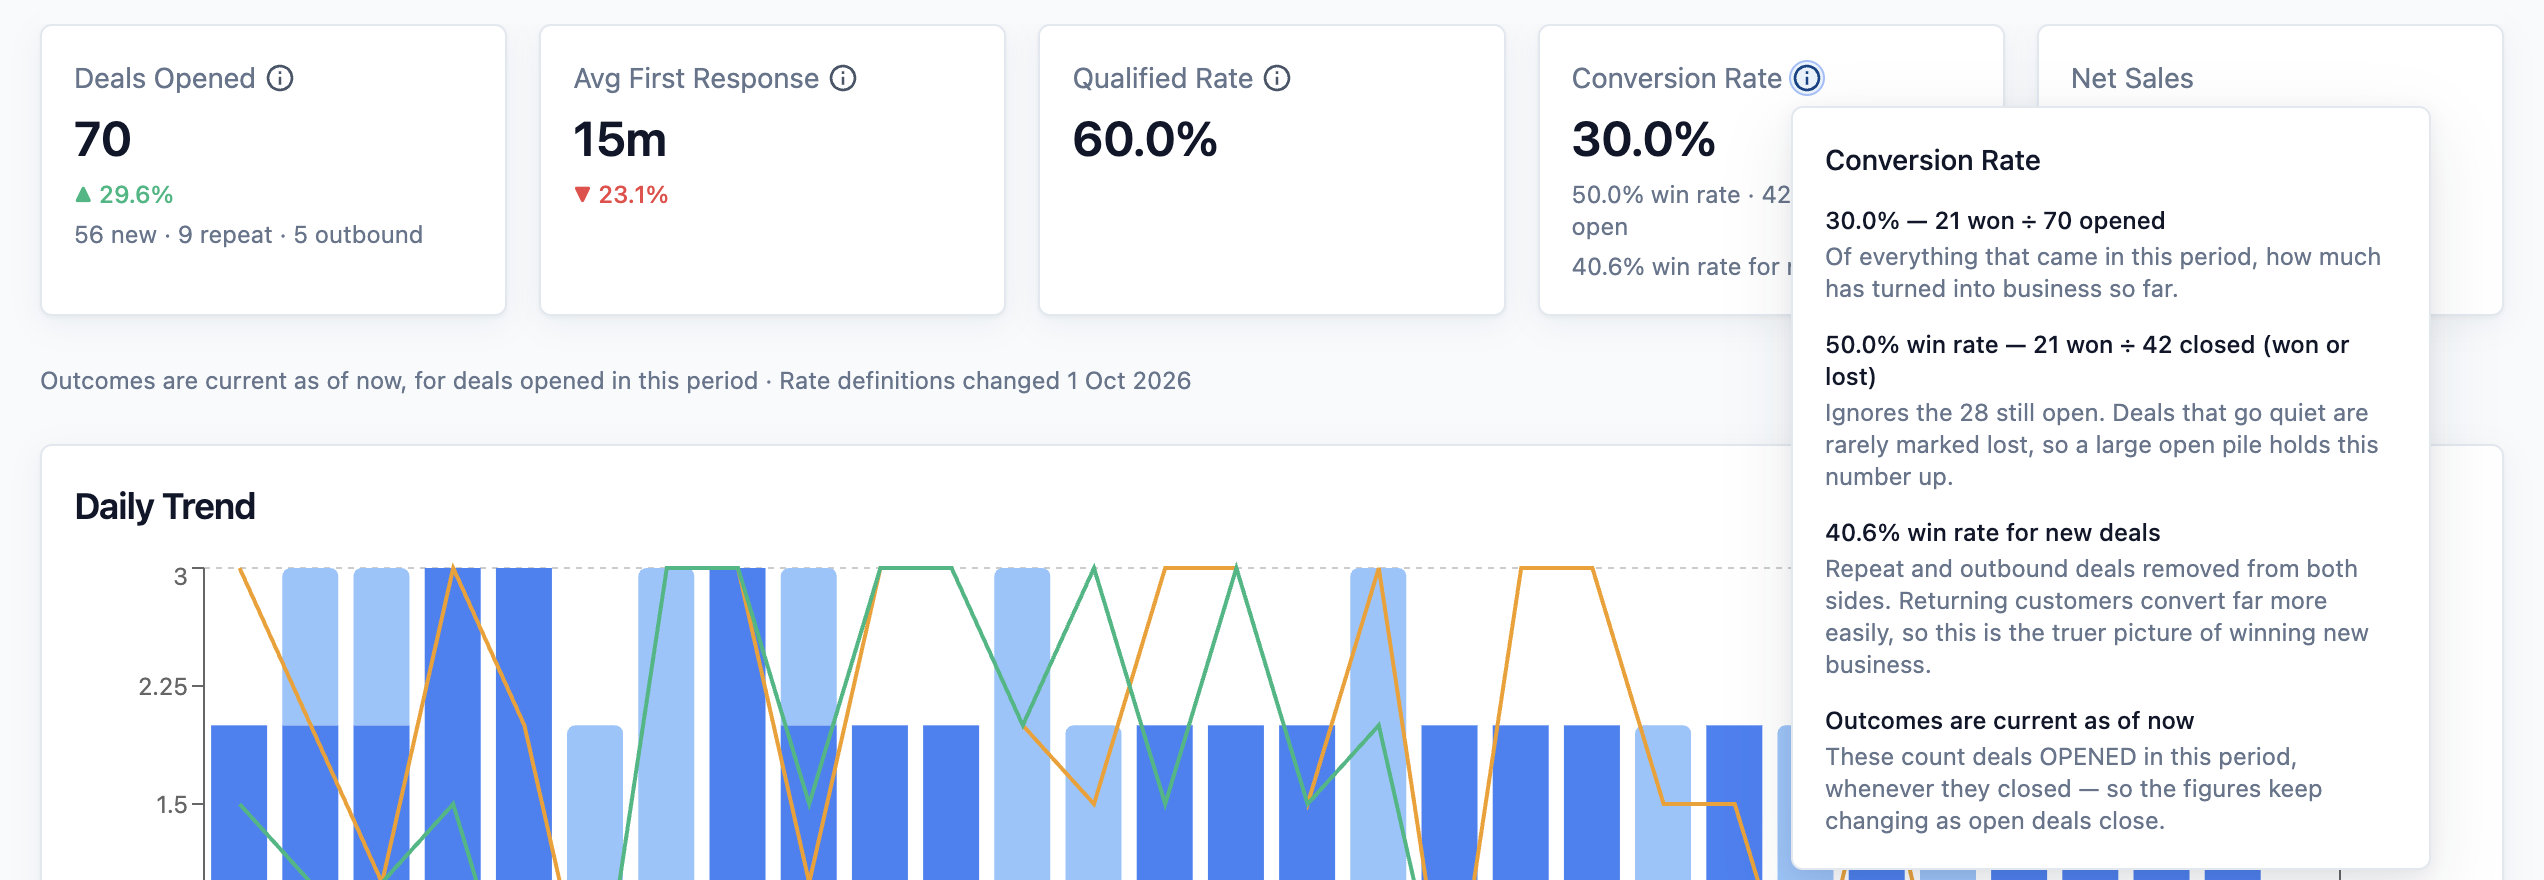
Next to each card title is a small help icon. Click it to see how this period's number was worked out, for example "10 won ÷ 40 opened".
---
## Read Won, Lost and Conversion
A deal is **won** when it becomes an order, and **lost** when it ends without one. A deal that is neither is still **open**.
Under **Conversion Rate** you see a second line, for example "41.7% win rate · 24 closed · 16 open". Here is how the two rates differ:
- **Conversion Rate** is won deals out of every deal opened, including the open ones.
- **Win rate** is won deals out of the deals already decided, won or lost.
Read them together. Enquiries that go quiet are rarely marked as lost, so they stay open and can make the win rate look better than it is. A big open number is a sign that your staff have follow-ups to do.
The report counts deals by the day they were opened. A deal opened in March and won in April counts as a March win.
---
## Read the Daily Trend Chart
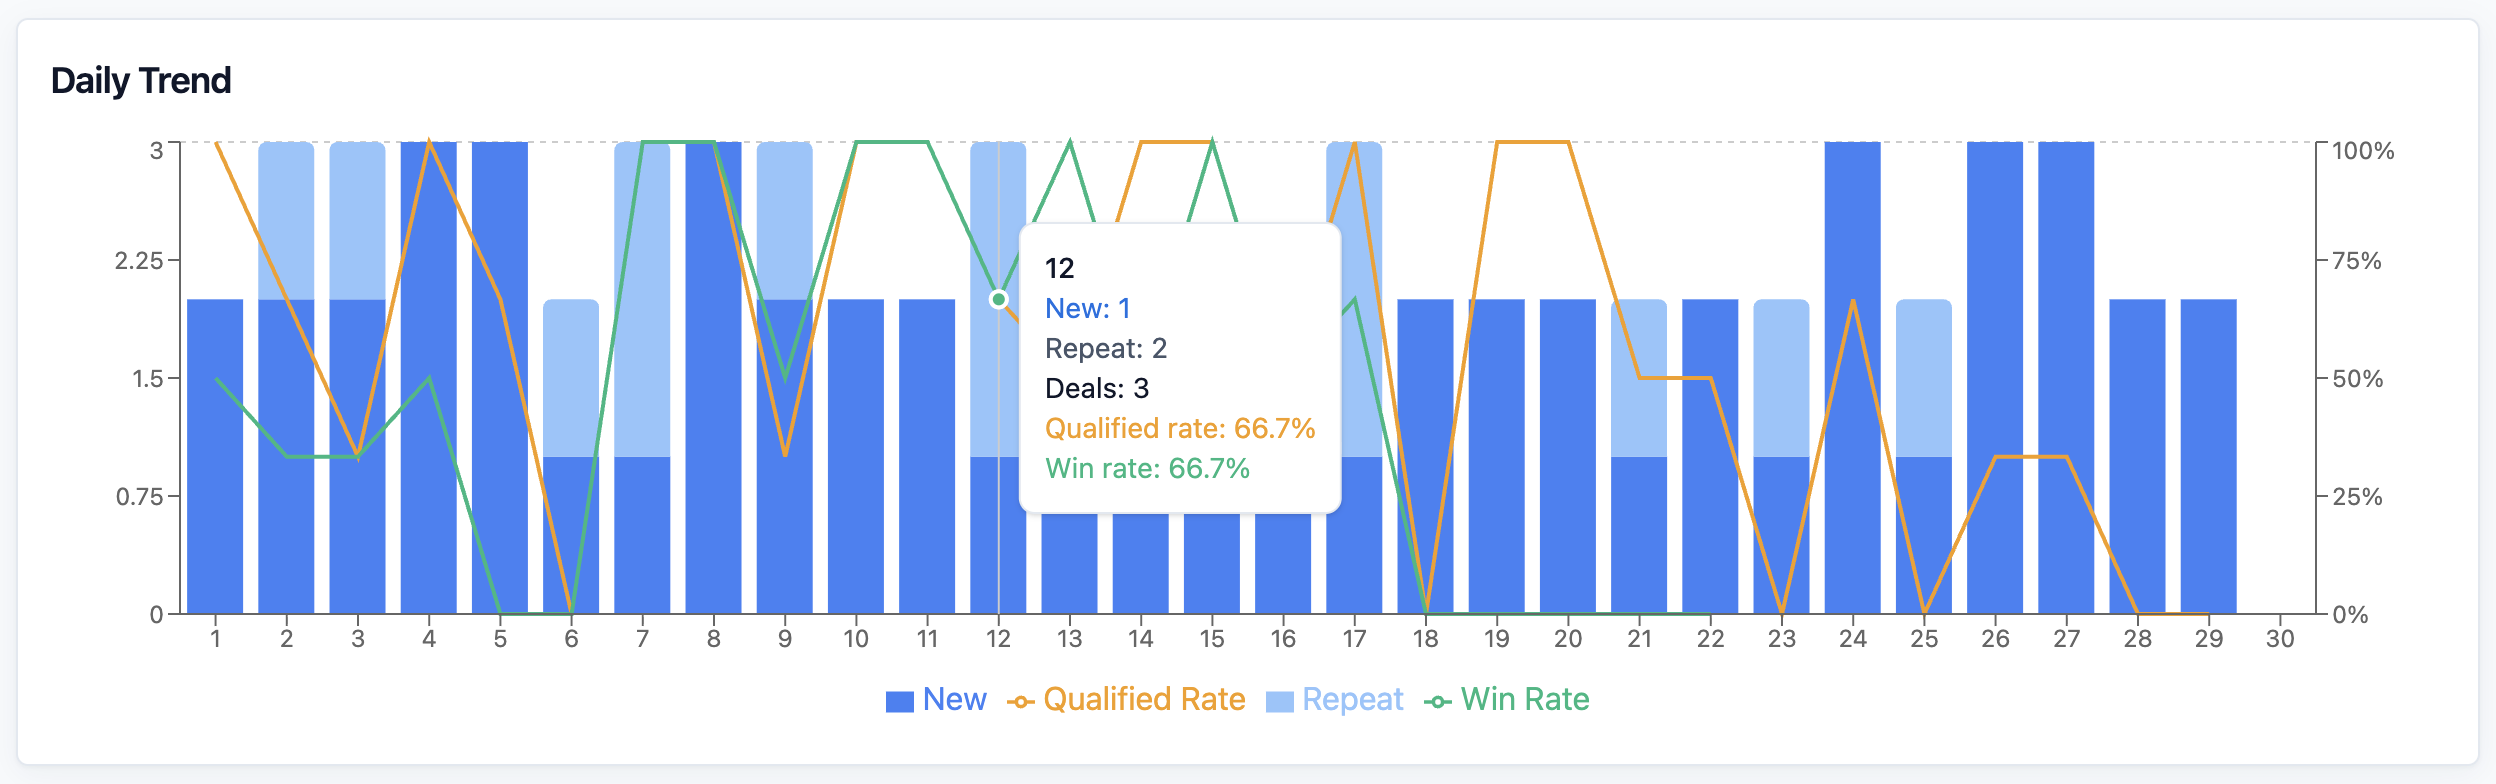
In Weekly, Monthly and Custom view, the chart below the cards is called **Daily Trend**. Daily view has no chart.
Each bar is one day. The dark part shows new enquiries and the light part shows repeat ones. The orange line is the **Qualified Rate** and the green line is the **Win Rate**. Hover over a day to see the exact numbers.
---
## Read the Staff, Source and Campaign Tables
Below the chart are tables that split the same deals in different ways:
- **Qualifying Staff**: the staff who handle the first reply. It shows each person's **Deals**, **Qualified**, **Qualified Rate**, **Won**, **Conversion Rate** and **Avg First Response**.
- **Closing Staff**: the staff who handle quotes and close the sale. It shows **Won**, **Lost**, **Win Rate**, **Net Sales**, **Avg Net Sales**, **Upsell** and **Upsell %**. These deals are counted in the period they closed.
- **Source Performance**: one row for each source, with **Deals**, **Won**, **Lost**, **Qualified Rate**, **Conversion Rate**, **Net Sales** and **Avg Net Sales**.
- **Campaign Performance**: the same figures for each campaign, such as an advert or a WhatsApp broadcast. Click a campaign to filter the whole report to it.
The two staff tables only show when no Source or Staff filter is set. Click a column title to sort by it.

---
## See Deals by Stage
The **Deals** list at the bottom of the page shows every deal in the period. The number in its title is how many deals are listed.
1. Scroll down to the **Deals** list.
2. Above the list, click a stage button to show only those deals: All , Qualifying , Closing , Won or Lost . Only the buttons for stages that have deals appear.
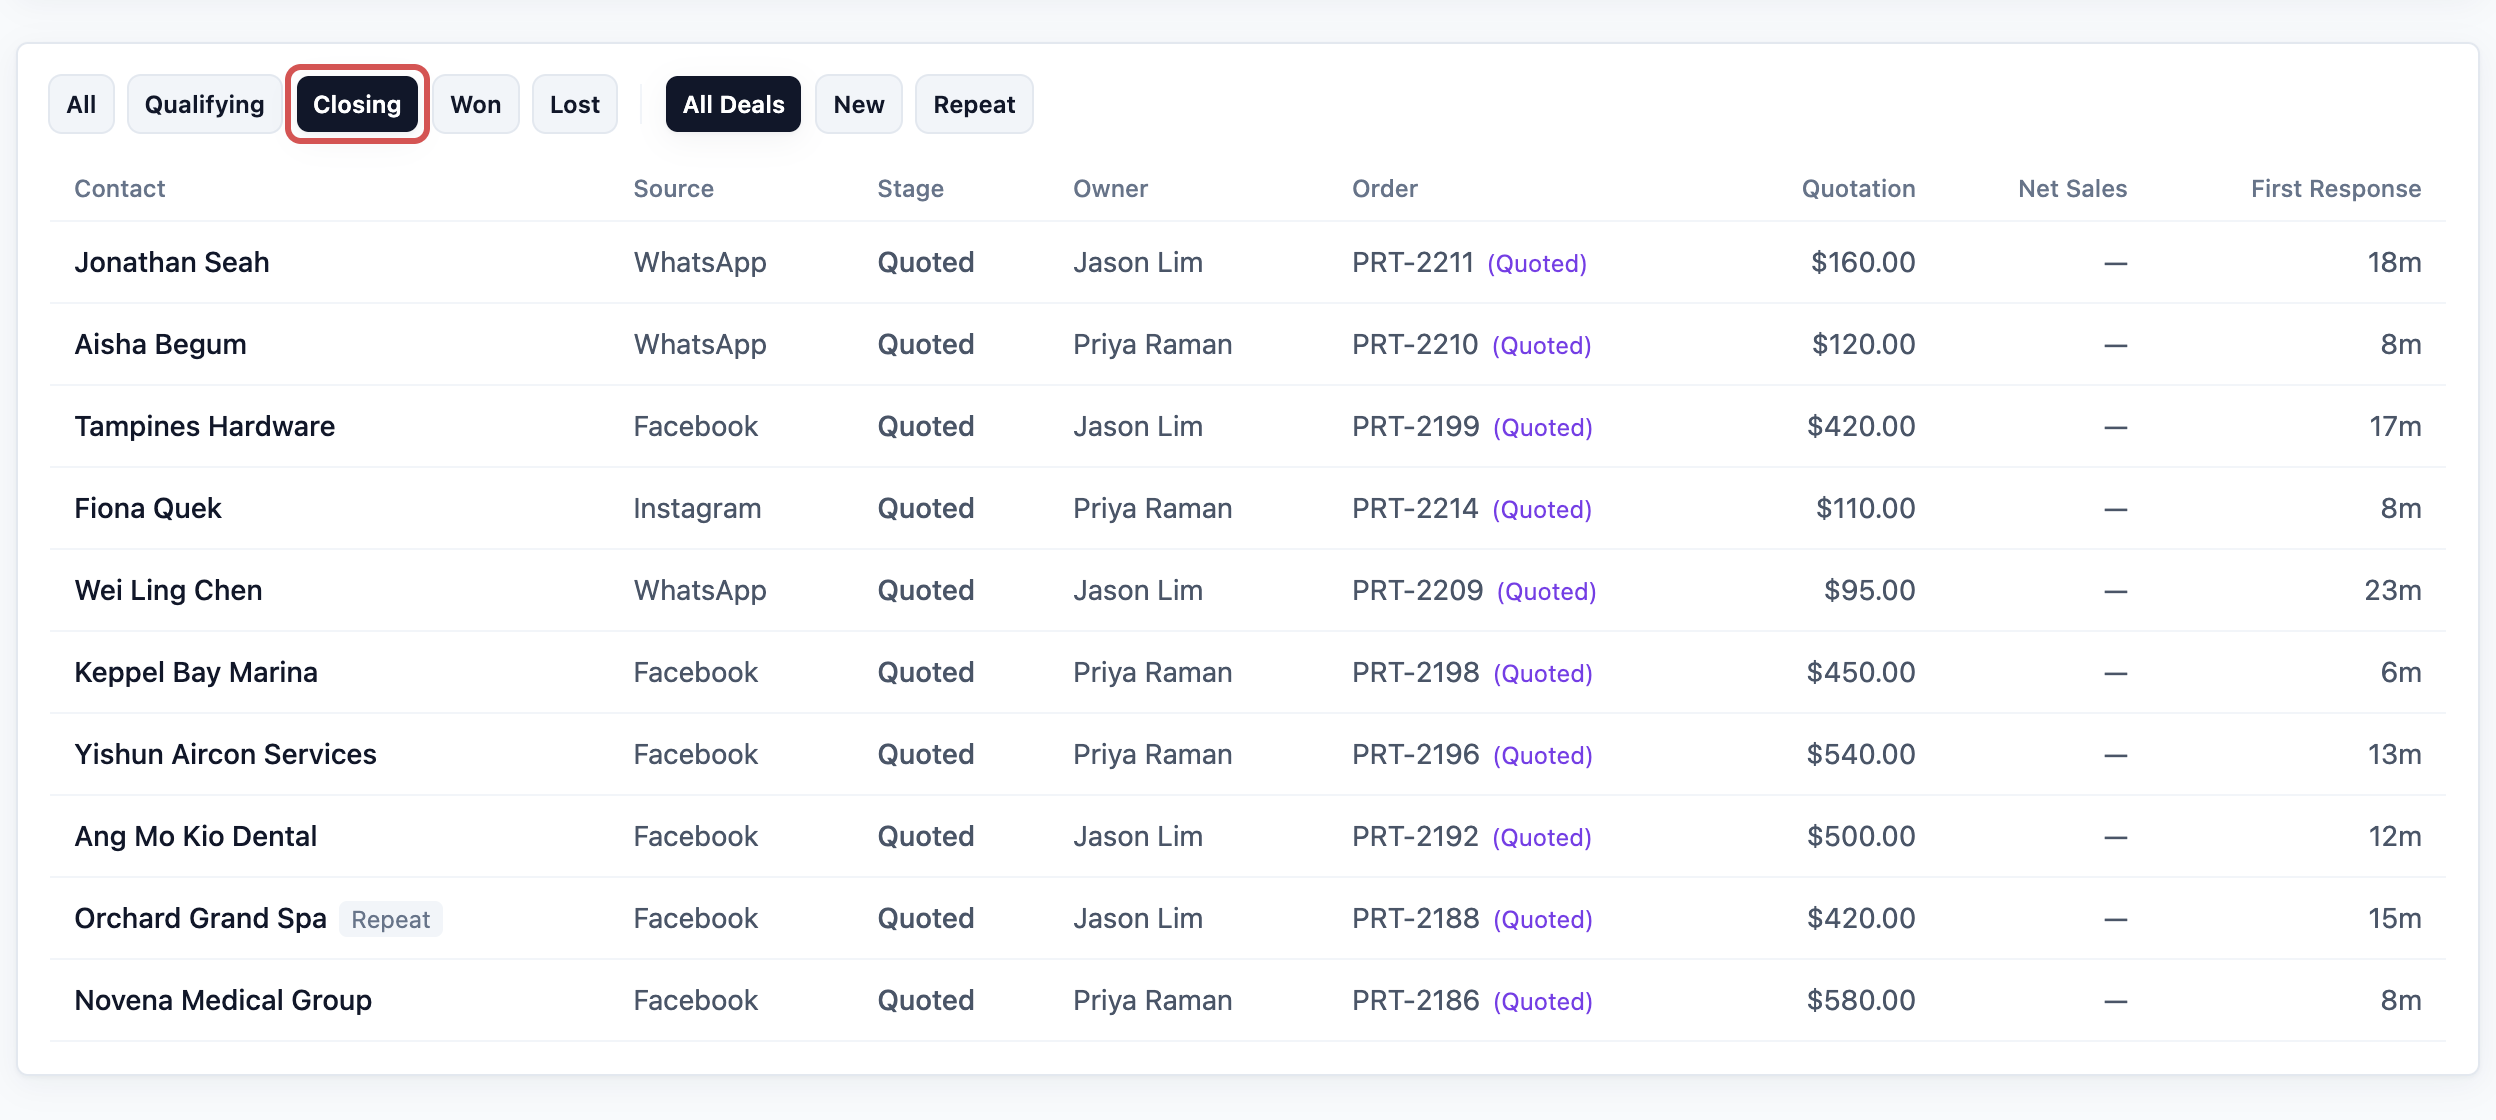
The stage buttons group your stages by what they do. Qualifying stages are first enquiries, such as New Enquiry. Closing stages are the ones where you are trying to win the sale, such as Quoted. The **Stage** column shows your own stage name for each deal.
3. If you see All Deals , New and Repeat , use them to show only first-time or returning customers.
4. Click a row to open that customer's chat in your Inbox, so you can follow up straight away.
Each row also shows the **Order** linked to the deal and its status, the **Quotation** amount, the **Net Sales** of the order and how long the **First Response** took.
---
## Export This Report
Export the Deals Report when you want every enquiry in a spreadsheet, for example to hand each staff member the customers they still need to call back.
1. Set the report to the day, week, month or dates you want.
2. At the top right, click Export .
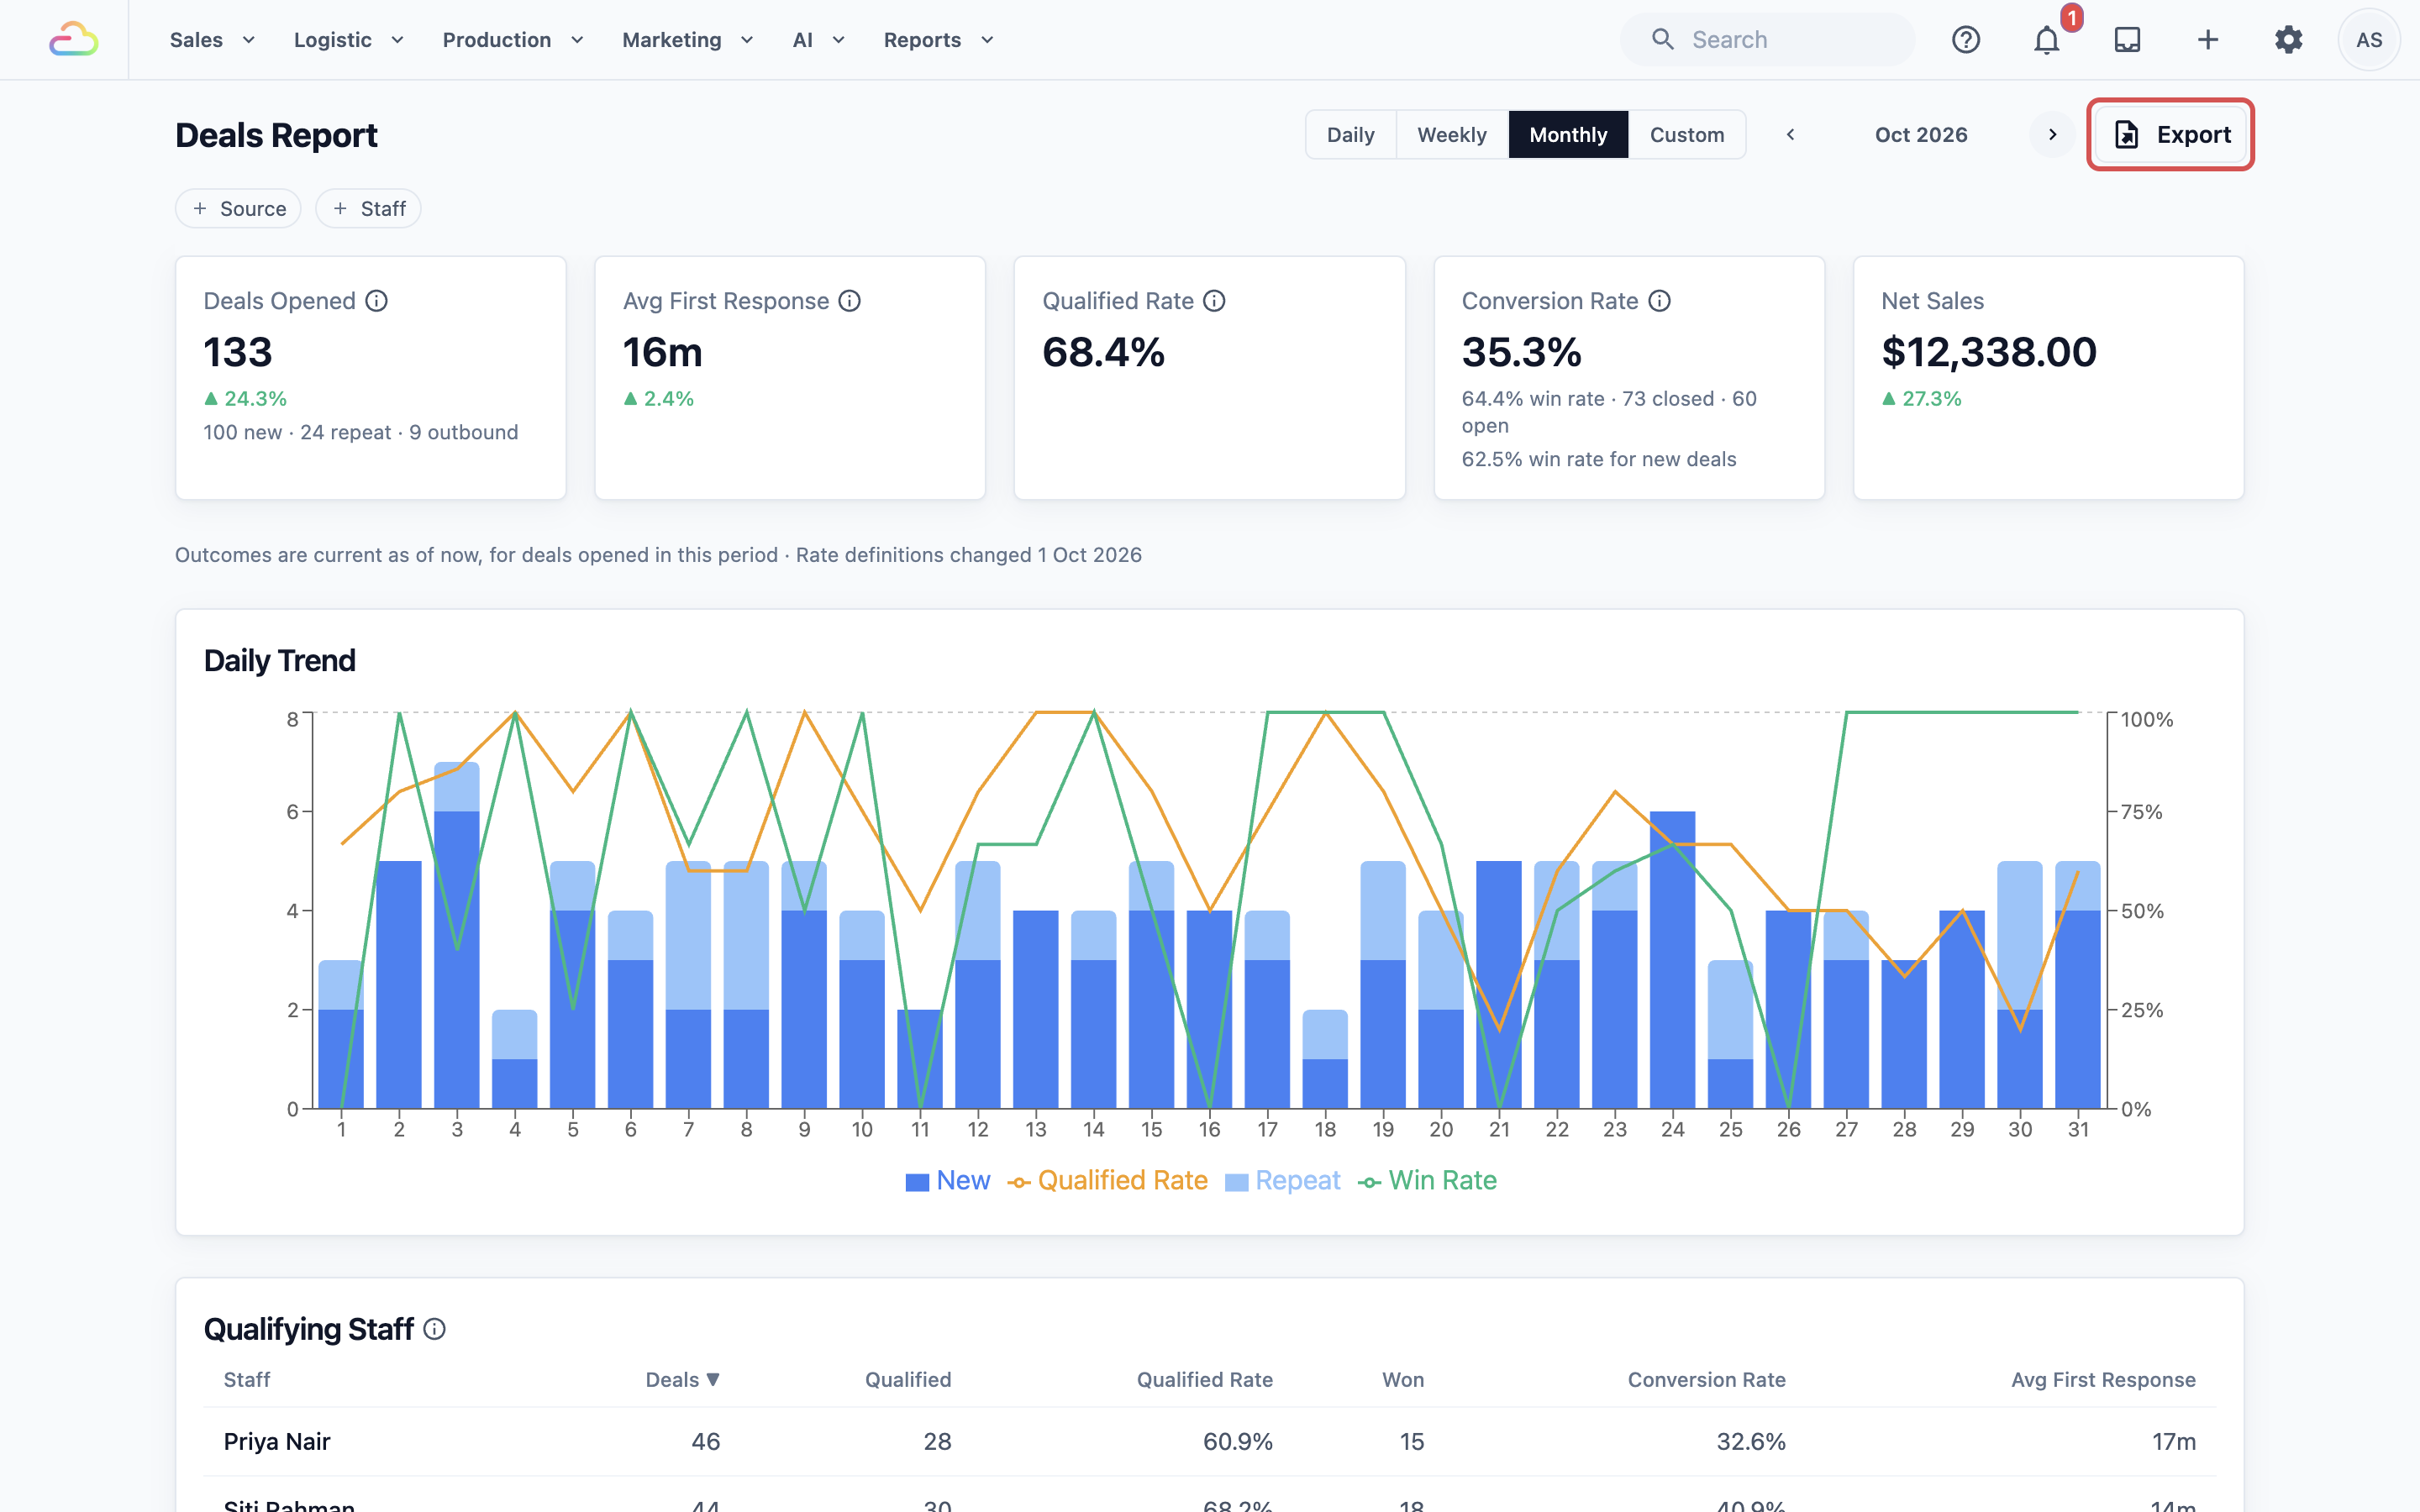
The **Export Deal Report** window opens.
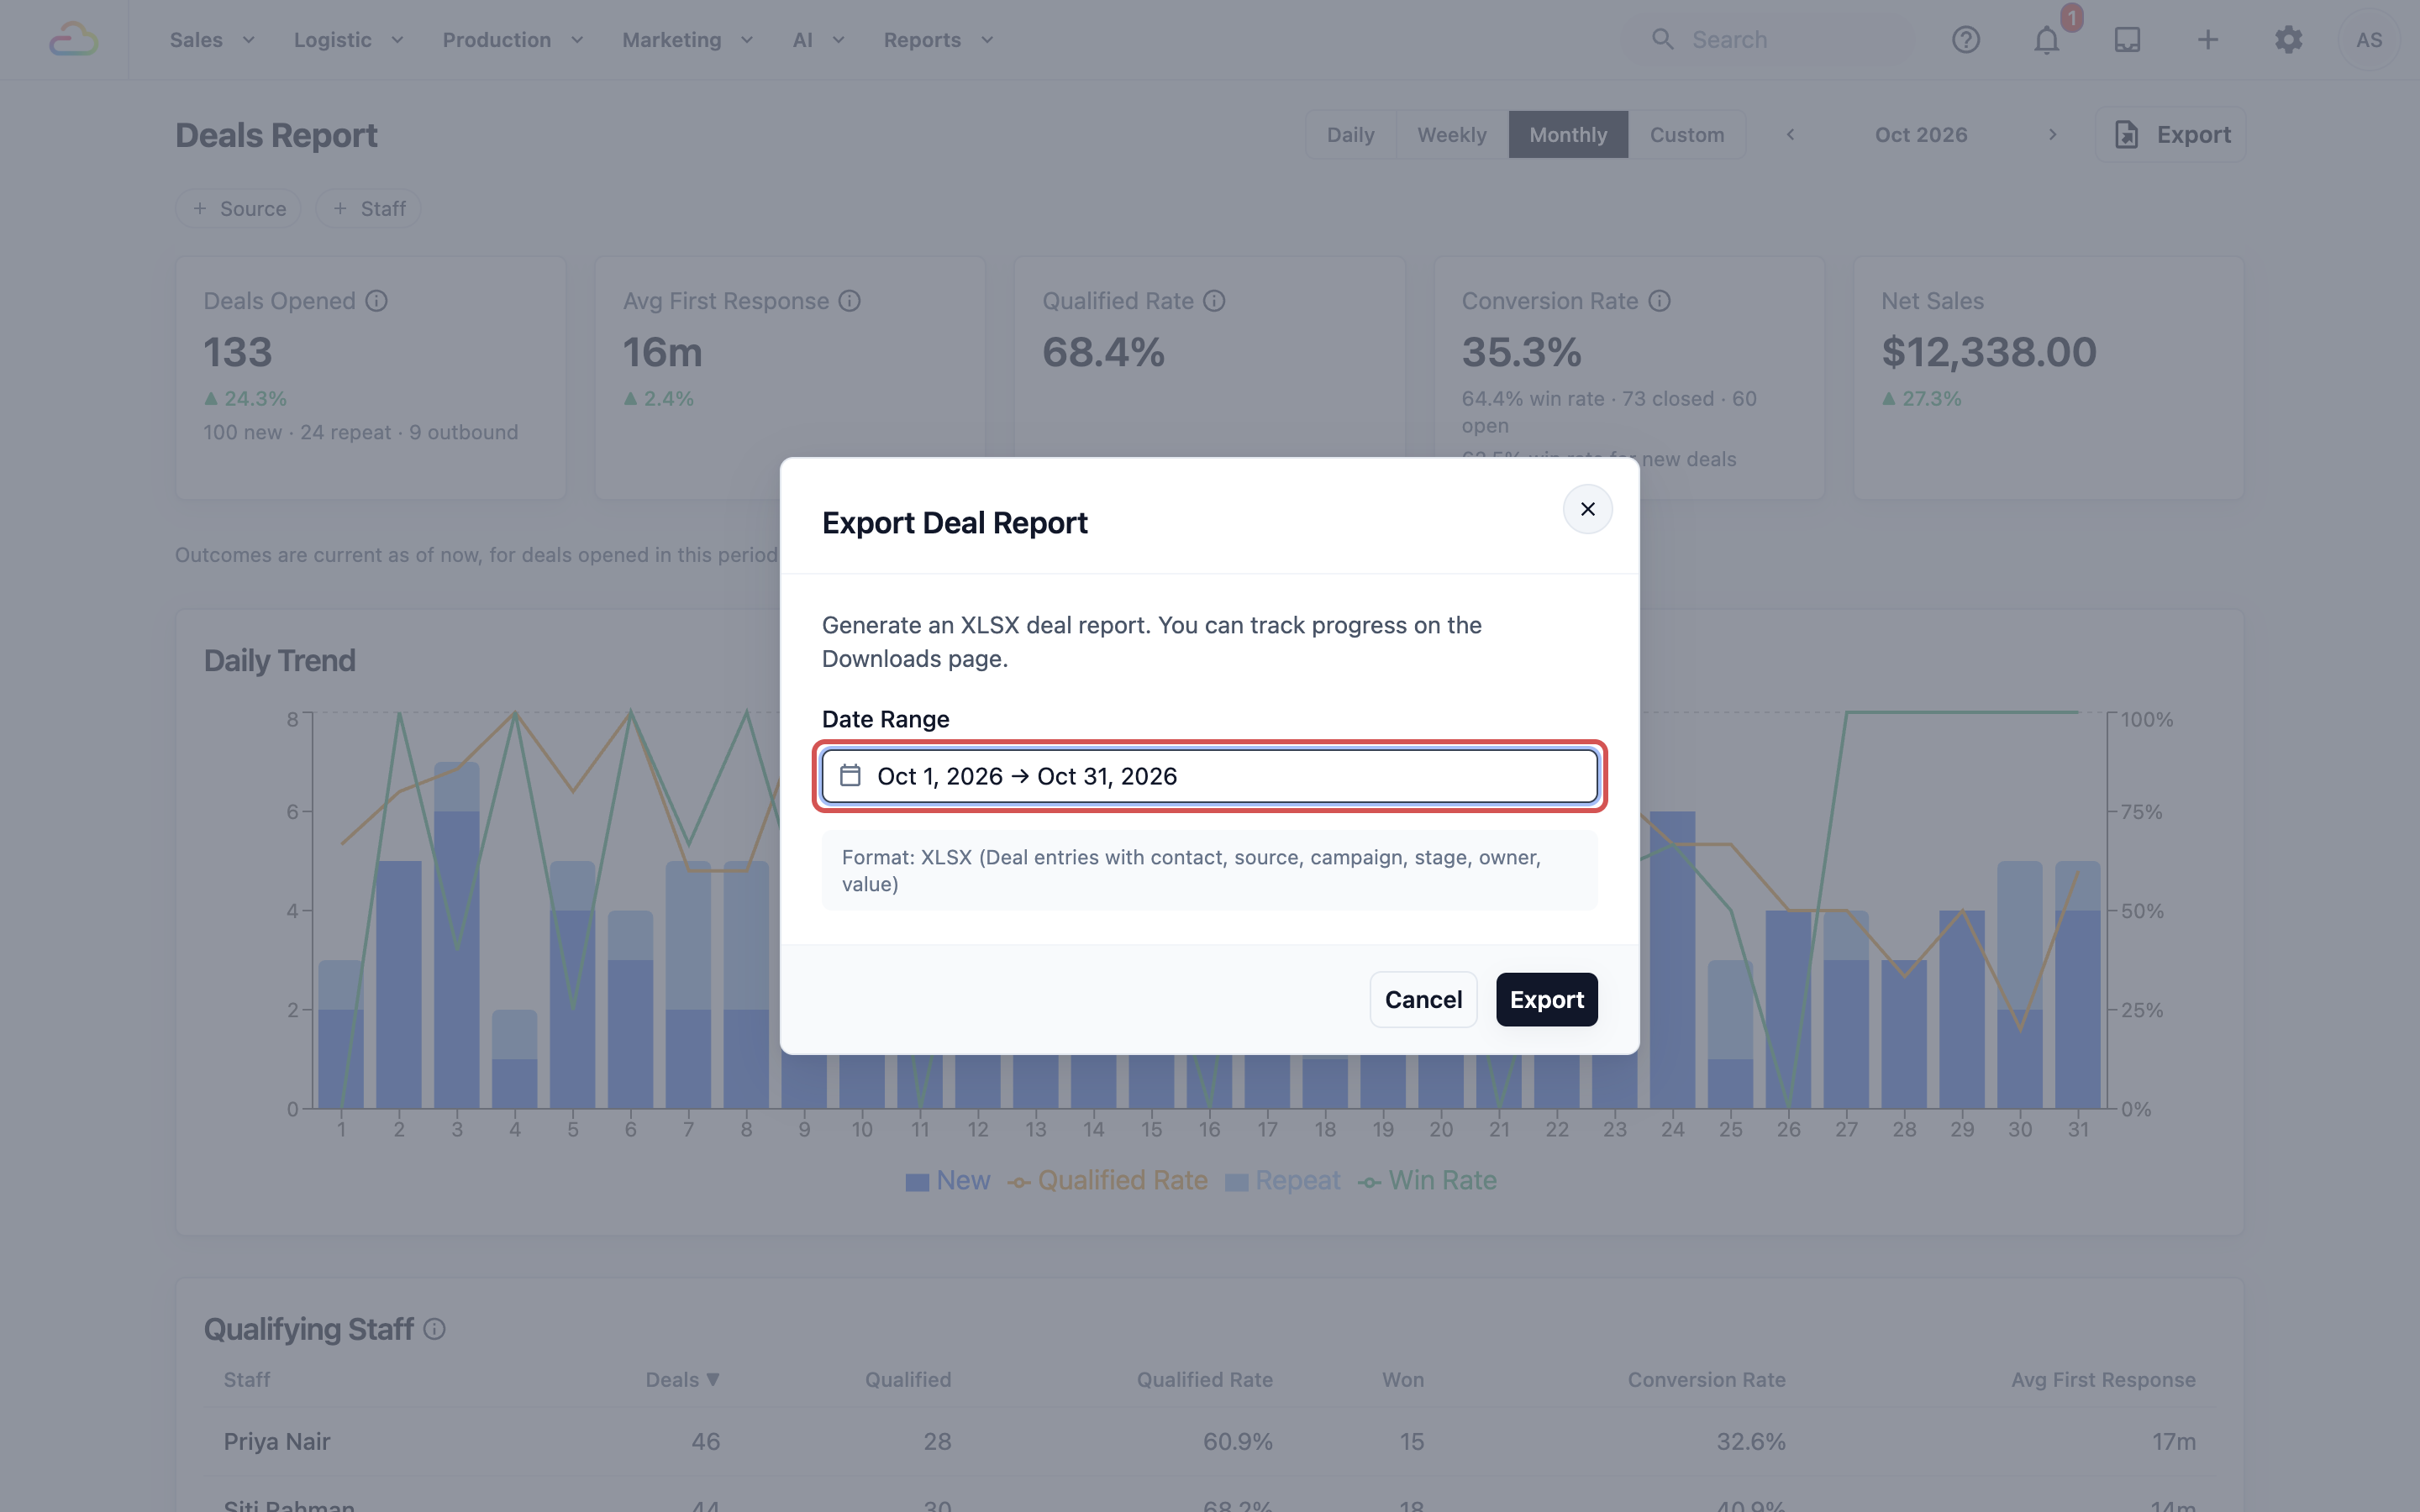
3. Check the **Date Range**. It starts with the period on the page:
| **View on the page** | **Date Range starts as** |
| ----- | ----- |
| Daily | The day you picked |
| Weekly | Monday to Sunday of that week |
| Monthly | The whole month |
| Custom | Your custom dates |
Change it here if you need other dates, for example the two months an advert ran. The file counts deals by the day the enquiry came in, like the report does.
4. Read the grey box under the dates. It shows **Format: XLSX (Deal entries with contact, source, campaign, stage, owner, value)**.
5. Click Export .
When **Export ready** shows under the button, click Download . The file is also kept on your Downloads page, where it is listed as **Deal Export**. See [Exporting to Excel and Downloads](/docs/exporting-reports-and-downloads).
### What carries over from the page
| **On the page** | **In the export** |
| ----- | ----- |
| Period (Daily, Weekly, Monthly or Custom) | Fills in the **Date Range**. You can change it in the window |
| **Source** filter, or a campaign you clicked | Not carried over. The file has deals from every source and campaign |
| **Staff** filter | Not carried over. The file has every staff member's deals |
| Stage buttons and New or Repeat | Not carried over. The file has deals at every stage, new and repeat |
The window has no sales channel choice. Deals belong to your whole shop, so every export has all of them.
### What's in the file
The file has one sheet, **Deals**, with one row for each deal that came in during your dates, newest first. It has no Summary sheet, so the cards and tables on the page are not in the file.
| **Column** | **What it shows** |
| ----- | ----- |
| Deal ID | EasyBiz's own reference for the deal |
| Date | The day the enquiry came in |
| Contact Name and Contact Phone | The customer's name and phone number from the chat |
| Source and Campaign | Where the enquiry came from, for example Facebook, and the advert or campaign if there was one |
| Stage | The deal's stage today, with your own stage name, for example Quoted |
| Qualifying Owner and Closing Owner | The staff member who handled the first reply, and the one handling the quote and sale |
| Deal Value | The same amount as the **Net Sales** column in the Deals list |
| Order No | The order linked to the deal |
| Remarks and Lost Reason | Notes your staff added, and why a lost deal was lost |
| Close Date | The day the deal was won or lost |
| First Response | How long the first reply took, for example 1h 5m |
| Last Customer Reply and Last Business Reply | When the customer last messaged you, and when your shop last replied |
To see only some deals, filter the columns in Excel, for example **Stage** for Quoted or **Campaign** for one advert.
The file has your customers' names and phone numbers. Share it only with people who need it.
---
## Example: PressRight Tracks Corporate Uniform Enquiries
PressRight is a dry cleaner that cleans uniforms for offices and hotels. Last month it ran a Facebook advert for corporate uniform cleaning. The owner wants to know if the advert paid off.
1. He opens Reports , then Deals , and clicks Monthly for last month.
2. In the **Source** filter, he picks the uniform campaign.
3. **Deals Opened** shows 40. **Conversion Rate** shows 25.0%, with "41.7% win rate · 24 closed · 16 open" underneath. **Net Sales** shows S$4,850.00.
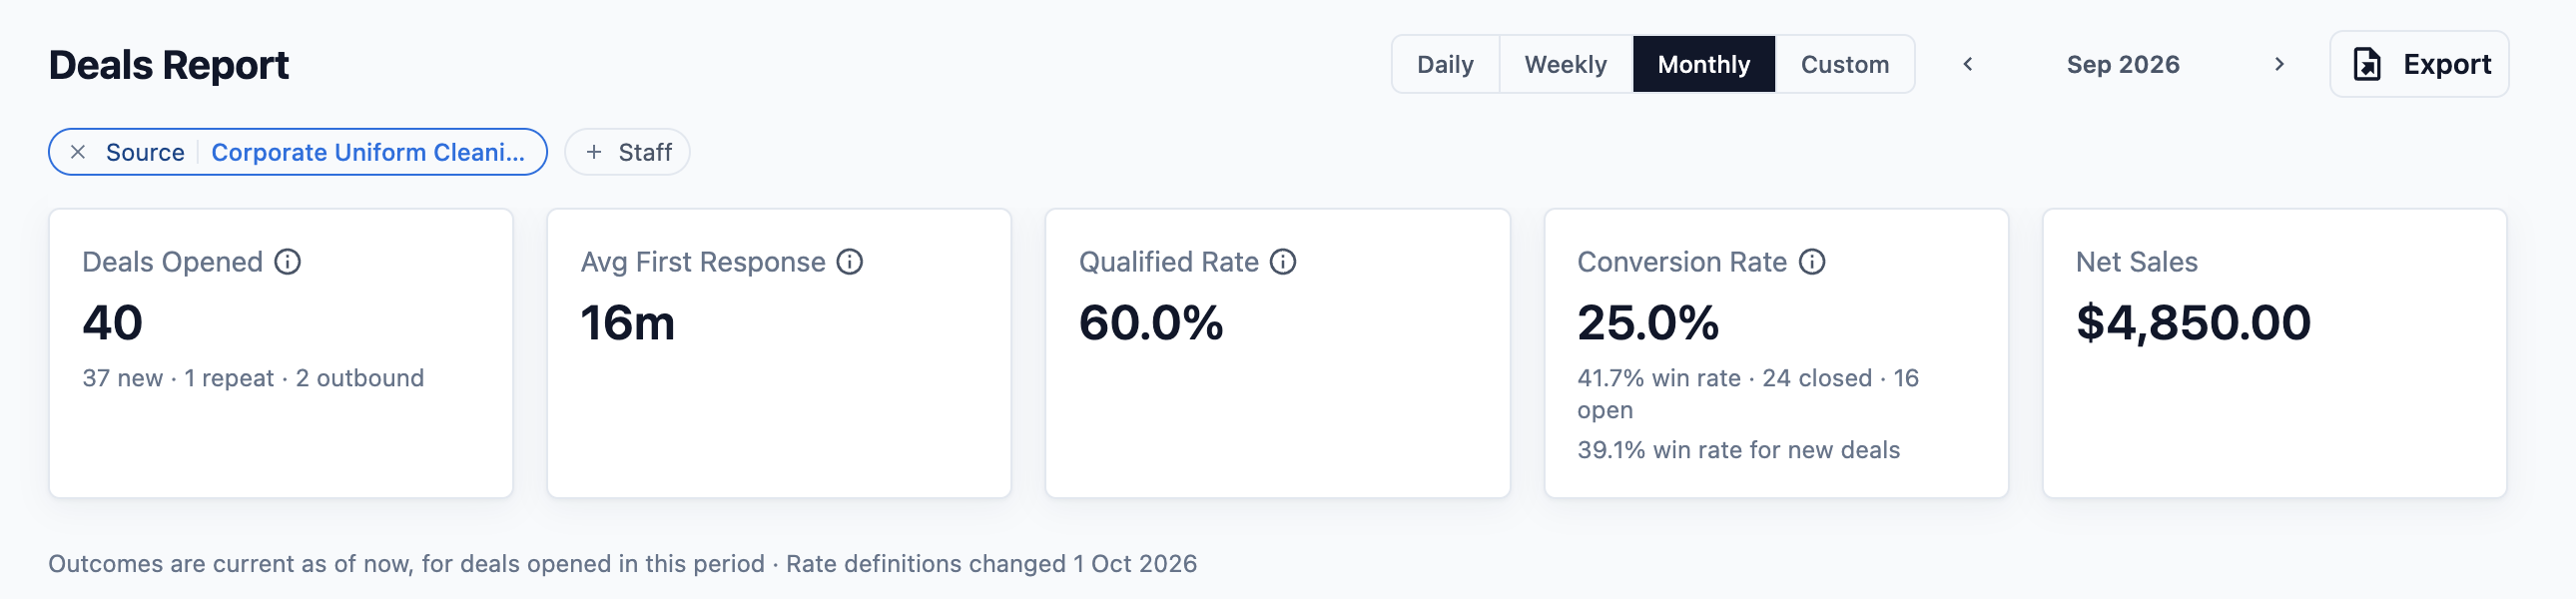
4. 10 companies became customers, and 16 enquiries are still open. He scrolls to the **Deals** list and clicks Closing . Six companies received a quote but never replied.
5. He clicks each row to open the chat and asks his staff to send a follow-up that day.
6. To keep track, he clicks Export , keeps last month's dates and downloads the file. In Excel, he filters **Campaign** to the uniform advert and **Stage** to Quoted, and gives each staff member the six companies' phone numbers to call.
The advert brought S$4,850.00 of orders, and PressRight still has six quoted companies to chase. The owner decides to run the advert again next month.
---
## FAQs
**Where do deals come from?**
>A deal opens automatically when a customer starts a new WhatsApp chat with your shop. The report remembers where they came from, for example a Facebook or Instagram advert, a tracking link or a reply to your WhatsApp broadcast. Chats that come in with no advert or link show as plain WhatsApp.
**Does a won deal create an order?**
>No, it works the other way round. When your staff create an order for that customer's chat, the order is linked to the deal and moves it along, for example to Quoted and then Won. The order's net sales then show as the deal's Net Sales. Marking a deal as won by hand does not create an order.
**Why does last month's Conversion Rate keep changing?**
>The report counts deals by the day they were opened, and shows their result as of today. So when an enquiry from last month turns into an order this week, last month's numbers go up. The note under the cards reminds you of this.
**Why doesn't Net Sales here match my Sales Report?**
>The Deals Report only counts orders that came from a deal, for the deals opened in the period. Walk-in customers and orders not linked to a chat are not included. The Sales Report counts every order. See [Reading the Sales Report](/docs/reading-the-sales-report).
**Why do the staff tables disappear?**
>The **Qualifying Staff** and **Closing Staff** tables only show when no Source or Staff filter is set. Clear the filter to see them again.
**Why does my exported file have deals from every source?**
>The Export window only asks for dates. The Source and Staff filters and the stage buttons on the page don't go into the file, so it has every deal that came in during those dates. Filter the **Source**, **Campaign** or **Stage** column in Excel to narrow it down.
**Can my staff see the Deals Report?**
>Only if you give them report access. Many owners give it to their sales lead or shop manager only. See [Report Access for Staff](/docs/report-access-for-staff).
---
## What's Next
You can now see how many enquiries came in, how many you won and which ones still need a follow-up. Next, learn how to see how much work each of your staff finished in [Reading the Production Report](/docs/reading-the-production-report).